Business Process Sigma Tab
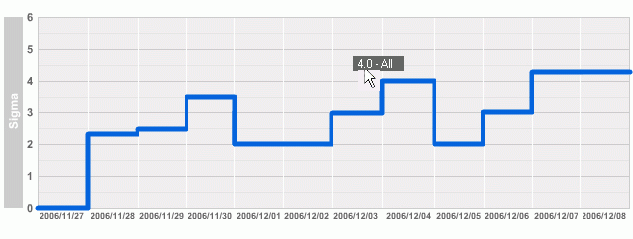
The graph on the Business Process Sigma tab shows the Six Sigma value the process achieved for each day. This value represents the percentage of readings that did not violate a rule.
The following table lists the percentages that the sigma scale represents.
Sigma | % Of Readings Without Violations |
1σ | 31.0000 |
2σ | 69.6186 |
3σ | 93.1489 |
4σ | 99.3722 |
5σ | 99.9766 |
6σ | 99.9996 |
For example, in the following process sigma graph, the sigma value is 0.79, indicating that fewer than 31 percent of the readings taken for all processes on December 5 did not violate a rule.
Figure 2. Business Process Sigma graph

