Viewing Diagnostic Information
The Diagnostics page provides a report of information to assist in troubleshooting issues with event maps, dimensions, hierarchies, KPIs, and rules.

To view diagnostic information
1. In My webMethods:
Navigate > Applications > Administration > Analytics > Diagnostics
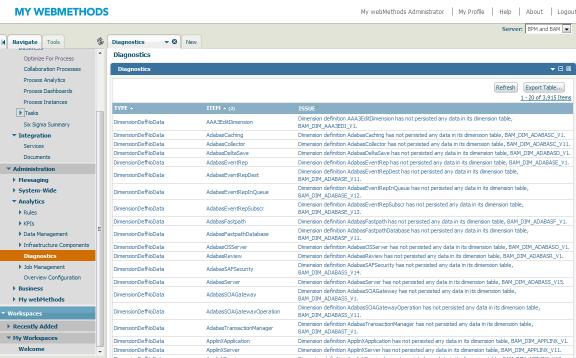
Optimize displays the Diagnostics page with a report of diagnostic information.
2. View the information on the Diagnostics page.
The following table describes the information on the Diagnostics page.
Column | Description |
TYPE | This column lists the area of the system that is connected to the issue. The listed area can be an event map, a dimension, a measure, a dimension hierarchy, a KPI, or a rule. |
ITEM | This column lists the measure name or the dimension name connected to the issue. |
ISSUE | This column describes the issue. |
As indicated by the up or down triangle beside each column head, you can sort issues by each column. Once you have sorted a column, the other two columns show either a (2) or a (3), indicating that column is either the secondary sort key or the tertiary sort key, respectively.