Viewing KPI Instance Details in Tabular Format
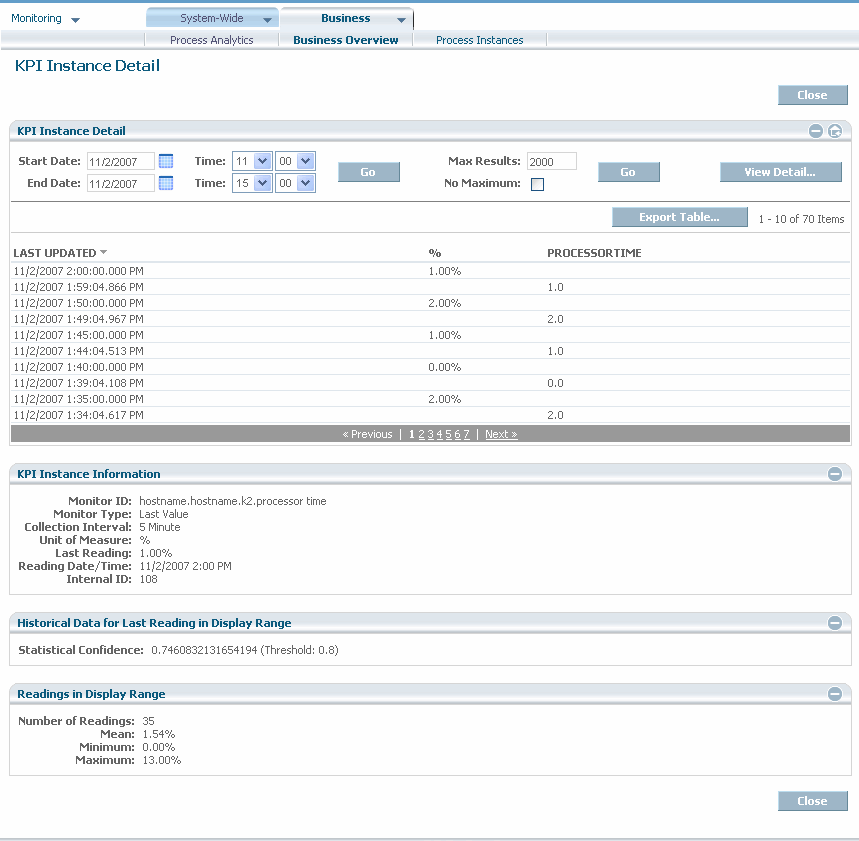
Figure 5. KPI Instance Detail data page
The example above shows processor times for the system component that has the KPI Instance ID of hostname.hostname.k2.processor time.

To view KPI instance details in tabular format
1. On the KPI Instance Detail graph page, click  in the upper right corner and select View Data.
 The KPI Instance Detail panel displays data for the KPI instance in tabular format. Each row of the table represents either:

A data point plotted within the selected time range on the KPI Instance Detail Graph page.

Associated transaction data (if any).
Three panels of information also display: KPI Instance Information, Historical Data for Time of Last Reading, and Readings in Last Time Period.
The following table describes the columns of the KPI Instance Detail panel.
Column | Description |
LAST UPDATED | The date and time when the data for the KPI instance was collected or data for the associated transaction (if any) was recorded. The data displays in reverse chronological order (starting with the most recent data). |
Data value (formatted) | The data value collected for the KPI instance. The column heading specifies the unit of measure. |
Name of transaction data (if any) | Zero or more columns of transaction data attached to the business or system data monitored by the KPI (for example, order number and required ship date). |
Note:
In Optimize for Process, because aggregated business data is retained for a longer period of time than non-aggregated business data by default, you might notice some discrepancies in the data displayed in the KPI Instance Detail panel. Use the graphical display format instead, or adjust the Business Days to Retain and Aggregated Days to Retain data purge parameters (see “Configuring Data Purge” in Administering webMethods Optimize), to avoid these discrepancies.
Below the table, the page also contains the
KPI Instance Information,
Historical Data for Time of Last Reading, and
Readings in Last Time Period panels as described in
Viewing KPI Instance Details in Graphical
Format.
2. If you want to change the time range for which KPI instance details are reported, complete the Start Date, End Date, and Time boxes and then click Go.
3. Perform any of the actions that are listed in the following table.
If you want to | Do this |
Export the data in the table to a comma-delimited text file | Click Export Table. For more information about exporting table data, see Working with My webMethods. Note:
The export includes both formatted data and raw unformatted data. The raw data is provided to enhance external analysis of the data. |
View details about the process instance (if any) that generated data associated with the KPI | |
View KPI instance details in graphical format | |

