Specifying the Comparison Period
You can compare KPI instances using standard time ranges or any time range that you specify.
The following table explains how to specify the comparison period.
To specify | Do this |
A standard time range. | Click a RANGE value at the top of the KPI performance chart: 1 hour, 4 hours, 8 hours, 12 hours, 1 day, 1 week, 2 weeks, 1 month, 3 months, or Max (the maximum time range). The slider adjusts to cover the time range you specified. Each RANGE value displays the most recent data, regardless of the currently selected time range. For example, you are displaying data for a previous month and you click the 1 day RANGE value. The data for the most recent 24-hour period displays. |
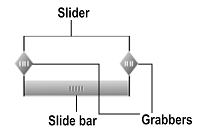
A non-standard time range. | Expand or shrink the slider by moving one or both of its grabbers. As you move the grabbers, the display of the time range changes in the upper right corner of the KPI performance chart. |
The time scale and units on the time axis of the graph area change after you select a standard time range or adjust the grabbers.
Note:
For information about how
Optimize aggregates data when the time range changes, see
Data Aggregation.
The following table explains how to select data for the comparison.
To select data for the comparison | Do this |
Using the slide bar. | Move the slide bar along the time range selection bar. |
Using the mouse pointer. | Position the mouse pointer anywhere in the graph area and drag to move the graph. |
Using the mouse wheel. | If your mouse is equipped with a mouse wheel, you can move the viewing period forward or back one time range at a time. |