Services
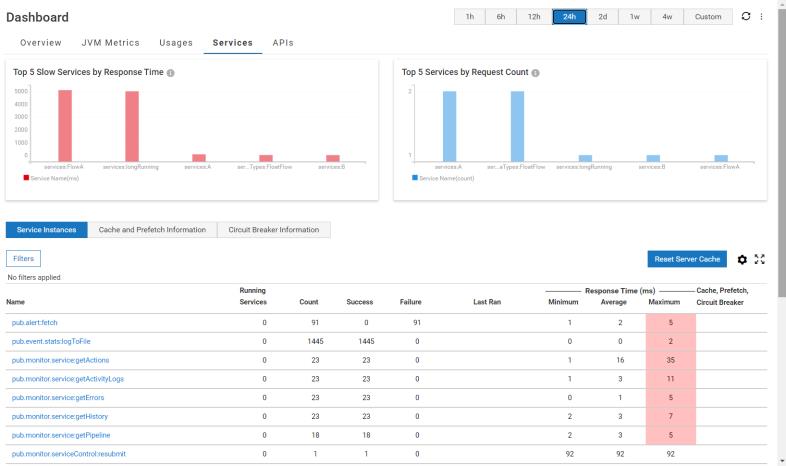
The Services tab consolidates the data from all the nodes in the same cluster. The service graphs show the top services sorted by response time and the request counts in descending order. Unlike request metrics on the Usages tab, metrics on the Services tab include services at all levels.

The Services tab shows the following graphs:
 Top 5 Slow Services by Response Time
: The top 5 services that have the longest average response time over the time range (excludes system services).
 Top 5 Services by Request Count
: The top 5 services that have the most request count over the time range (excludes system services).
The Services tab also shows the following data related to Service Instances, Cache and Prefetch Information, and Circuit Breaker Information.
Option | Description |
Filters | You can filter the table in the Service Instances tab using the Filter command in this tab. This enables you to exclude system services and services that are not running currently from the view. |
Reset Server Cache | You can reset the server cache to clear the count and restart the data collection timers for all the services. To reset the cache for a specific service, you can use the pub.cache.serviceResults:resetServiceCache service. |
Settings | Using the Settings menu, you can:  Enable Zebra stripes if you want to display alternate rows with different background colors.  Select which columns you want to display in the table using the Show Columns menu option. |
