Overview
The Overview tab shows key system properties for the current Integration Server instance.
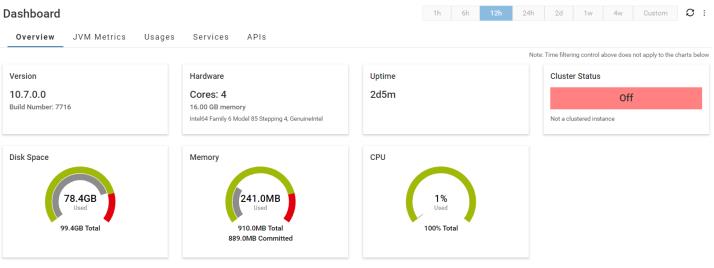
The Overview tab displays the following information using information boxes and charts:
 Version
: Displays the complete version of the
Integration Server instance
Hardware: Displays the type of processor and the total amount of memory available on the machine.
Uptime: Displays the time in hours and minutes since the current
Integration Server instance was started.
Disk Space: This chart displays the following information:
Total: The total amount of space on the disk on which the current
Integration Server instance is installed.
Used: The amount of used space on the disk on which the current
Integration Server instance is installed.
The red section of the
Disk space card displays the
Threshold of disk space usage. The
watt.server.dashboard.diskspace.threshold server configuration parameter determines the threshold. For more information, see
watt.server.dashboard.diskspace.threshold in
watt.server..
Memory: This chart displays the following information:
Used: Shows the amount of memory that is being used by the Java Virtual Machine (JVM).
Total: Shows the maximum amount of memory the Java Virtual Machine (JVM) is allowed to acquire.
Committed: Shows the amount of memory guaranteed to be available for use by the Java virtual machine.
The red section of the
Memory card displays the
Threshold of memory usage. The
watt.server.dashboard.memory.threshold server configuration parameter determines the threshold. For more information, see
watt.server.dashboard.memory.threshold in
watt.server..
CPU: Recent CPU usage of the Java Virtual Machine process
Cluster Status:
Cluster Status:
On if the current
Integration Server instance is part of a cluster.
Off if the current
Integration Server instance is not part of the cluster.
Unknown if statistics data collection is disabled in the current
Integration Server instance, irrespective of it being part of a cluster.
Cluster State: Depending on the state of the cluster, one of the following messages is displayed:
Cluster is working
Cluster is not working
Not a clustered instance
Statistics data collection is disabled