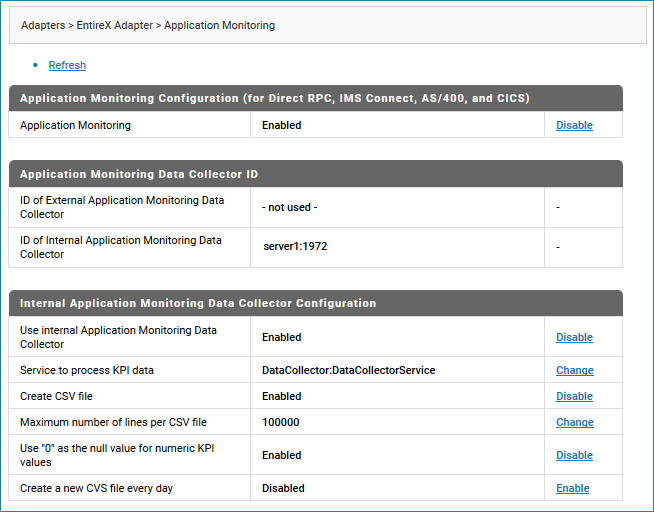
Application Monitoring is an EntireX feature that enables you to monitor the response times in your distributed applications, and it also enables you to monitor certain error situations. See Application Monitoring. To configure it, from the administration menu of the EntireX Adapter choose Application Monitoring.
You can either use the internal Data Collector of the Adapter (parameter Use internal Application Monitoring Data Collector is enabled),
or an external Data Collector running outside of the Integration Server (parameter Use internal... is disabled).

| Parameter | Description | Default | Note |
|---|---|---|---|
| Application Monitoring Configuration | |||
Application Monitoring |
Enable or disable Application Monitoring for the EntireX Adapter. Applies to the following connection types:
|
disabled | For connection types EntireX RPC Connection and EntireX RPC Listener Connection, configure the used broker instance. See Setting up EntireX Broker in the Application Monitoring documentation. |
| Application Monitoring Data Collector ID | |||
ID of External Application Monitoring Data Collector |
Required if using an External Collector. Must be in format host-name:port-number, where host-name is the host on which the Application Monitoring Data Collector is running, and port-number is the port number of the Data Collector.
|
||
ID of Internal Application Monitoring Data Collector |
You cannot change the address of the EntireX Adapter's internal Data Collector. It is always the hostname of the machine where the Integration Server is running and the TCP/IP port number of the Direct RPC component. | ||
| Internal Application Monitoring Data Collector Configuration | |||
Use Internal Application Monitoring Data Collector |
Enable this parameter to use the internal Data Collector. This collector runs as a server in the Direct RPC component and is started and stopped automatically when the Direct RPC component is started or stopped. | disabled | |
Service to process KPI data |
Enter the full name of the service to consume the KPIs. This service is called with the available KPI values when the Data
Collector receives a monitoring event.
To define the signature of such a service, use a reference to the specification pub.wmentirex.appmon:ApplicationMonitoringKPIs.
|
The monitoring KPIs can be consumed by an Integration Server service or written to a CSV file (or both). | |
Create CSV file |
If this parameter is enabled, the CSV files are stored in the subfolder appmondc of the resources folder of the package WmEntireX, for example .../IntegrationServer/instances/default/packages/WmEntireX/resources/appmondc. | enabled | |
Maximum number of lines per CSV file |
The maximum number of rows per CSV data file. If the limit is reached, a new file is created. | 100000 | |
Use "0" as the null value for numeric KPI values |
Use "0" instead of an empty entry as the null value for all numeric KPI values in the CSV file. | disabled | |
Create a new CSV file every day |
A new CVS data file is created automatically every day. | disabled | |