
This document describes how to get an overview of your broker and registered services; how to monitor individual components, either as a snapshot or over time. It also shows a typical scenario where you use command-line scripts to monitor over time your EntireX environment as a whole.
All options and more scenarios are described in the separate documentation section EntireX Monitoring Scripts.
The monitoring scripts available with EntireX allow you to define your environment, to monitor it and to define actions in case of an error. Although the scripts are installed and run on Microsoft Windows, you can monitor your EntireX environment that is running on any other operating system. You can specify any broker accessible in the network, for example one running under z/OS.
After installing EntireX on Windows you can find the shortcut to the monitoring scripts under > .
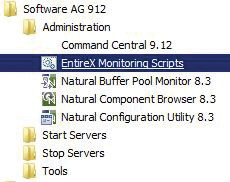
The following menu appears:
List of EntireX Monitoring Scripts Current Broker: localhost:1971 1 : Show Broker and registered Services The following scripts write to CSV file: 2 : Monitor Broker 3 : Monitor Services 4 : Monitor Clients 5 : Change current Broker (this session only) 6 : Edit Broker and other defaults (persistent) 7 : Define your Environment 8 : Monitor your Environment 9 : Open new command window (in script directory) 0 : Exit Enter the number to be executed or ? for help |
Choose Option 1 from the EntireX Monitoring Scripts menu for an overview of the specified broker and registered services.
For the specified broker you see:
information where the broker is running
license information
some basic settings
For the registered services you see:
the class/server/service to identify the service
for each service, basic KPIs such as number of active replicates (active server instances)
maximum of pending parallel conversations
number of times all server instances were busy
In addition to this menu option, you can also call this function using a script. See Show Broker and Registered Services under EntireX Monitoring Scripts for command syntax and more information.
Note:
This option provides a snapshot of your current environment.
The script runs once only and then terminates. You can also monitor your EntireX components over time.  More info
Overview of Broker localhost:1971 Broker ID : ETB001 Running on : pcusr1 Version : 10.7.0.00 License expiration: UNLIMITED Trace level : 0 Platform : PC Windows 10 Enterprise Client timeout : 900 Transport Settings NET : NO SSL : NO TCP : YES Dynamic Memory Management: YES Dynamic Worker Management: NO Re-read attribute file : YES Attribute file: C:\SoftwareAG\EntireX\config\etb\ETB001\ETB001.atr Log file : C:\SoftwareAG\EntireX\config\etb\ETB001\ETB001.log License file : C:\SoftwareAG\common\conf\exx107.xml Workers : Active: 1 Services : Active: 9 High Watermarks Servers : 1 Clients : 2 Conversations : 2 Memory : 30153112 List of Active (External) Services for Broker localhost:1971 Class : RPC Server : SRV1 Service : CALLNAT No. of times all server instances were busy: 0 Maximum of pending parallel conversations : 1 Total No. of requests : 1 No. of active server instances : 1 Conversation high watermarks : 1 End of overview |
The options described here monitor your EntireX components over a period of time. The scripts write basic KPIs to a CSV file. By default the CSV files are written to folder My Documents/Software AG/EntireX and are updated with the latest information, by default every 60 seconds. The scripts run until they are canceled. You can change the defaults with Option 6 from the menu. See also Default Handling under EntireX Monitoring Scripts for more information.
In addition to the menu options described here, you can also call the functions using a script. See Monitoring EntireX Components under EntireX Monitoring Scripts for command syntax and more information.
Note:
You can also create a one-off snapshot of your environment. More info
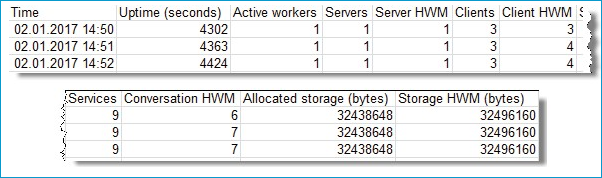
The CSV file for Option 2 shows the following information:
time when the report was taken
time (in seconds) the broker was running (uptime)
number of active workers, servers, services and clients
allocated memory
high watermarks (HWMs) for servers, clients, conversations and memory
Sample output:
In addition to the menu option described here, you can also call this function using a script. See Monitoring Broker under EntireX Monitoring Scripts for command syntax and more information.
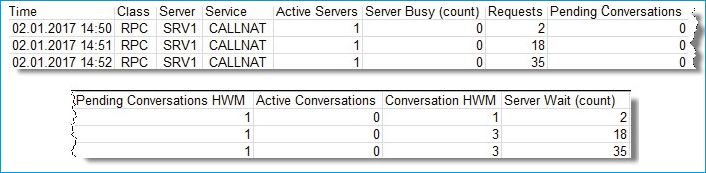
The CSV file for Option 3 shows the following information:
time when the report was taken
for each service that matches the selection: the class/server/service, which identifies the service
number of active servers providing this service
number of requests for this service
and information about the conversations
The server busy (count) is the number of times an incoming request had to wait because all instances of the server were busy. A high number (in relation to the total number of requests) may indicate that more replicates could help to improve the performance.
Sample output:
In addition to the menu option described here, you can also call this function using a script. See Monitoring Services under EntireX Monitoring Scripts for command syntax and more information.
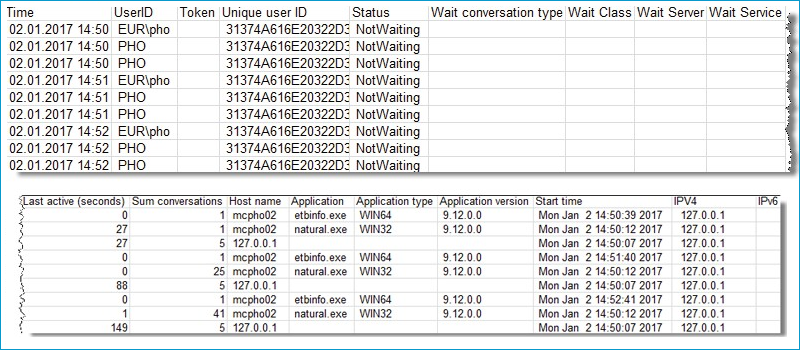
The CSV file for Option 4 shows the following information:
time when the report was taken
for each active client: the user ID, token, unique ID that identifies the client
status (waiting or not waiting)
start time of the client
host name where the client is running
information about the application
Sample output:
In addition to the menu option described here, you can also call this function using a script. See Monitoring Clients under EntireX Monitoring Scripts for command syntax and more information.
In this scenario you have an EntireX production environment with a broker and RPC or ACI servers that you want to monitor. You also want to receive notifications when a component of your environment goes down and is no longer available.
To do this, you can use the monitoring scripts available with EntireX. They allow you to define your environment, to monitor it and to define actions in case of an error. Although the scripts are installed and run on Microsoft Windows, you can monitor your EntireX environment that is running on any other operating system.
Use the options offered in the menu of the monitoring scripts to define and to monitor your environment.
Choose Option 7 to define your environment. This opens an editor with a sample definition of an environment. Adjust this definition to your needs.
Here you see an example of a basic environment:
ENVIRONMENT MyProductionServers
ERROREXIT handle_error.bat
BROKER myProductionBroker localhost:1971
@rem Example of a definition of an RPC Service
RPCSERVICE myRPCServer RPC SRV1 CALLNAT
@rem Example of a definition of an ACI Service
SERVICE myACIServer ACLASS ASERVER ASERVICE
An environment is defined by the keyword ENVIRONMENT, which you can define with a meaningful name.
You need to define the following for this environment:
a user-written exit to handle outages
the broker
ACI or RPC services
Note:
The broker does not have to be running on the local PC;
it can run anywhere in your network (as long as it is accessible from the PC where the monitoring script is running).
Use the keyword ERROREXIT to define your own error routine (a batch file) that is called in case of an outage.
The batch file has to be in the PATH so that the monitoring script can call it.
The error exit is called in case of an outage and provides information on the component (Broker or Server) that caused
the error.
File handle_error.bat is provided as an example.
Adjust the error exit to your needs (for example send a notification in case of an outage).
Use the keyword BROKER followed by your logical name of the broker and the broker ID to define the broker to be monitored.
See the provided sample environment for examples how to specify user ID and password if your broker is running with
EntireX Security.
Use the keyword RPCSERVICE (for an RPC server) or SERVICE (for an ACI service) followed by your logical name and the class, server and service to define the server(s) to be monitored.
You can define multiple servers. Example:
RPCSERVICE myCICSRPCServer RPC CICSSRV CALLNAT
@rem my CICS RPC Server
RPCSERVICE myBATCHRPCServer RPC BATCHSRV CALLNAT
@rem my Batch RPC Server
In this case the monitoring script will first check if the RPC Server for CICS can be called. Secondly it will check the availability of the RPC Server for Batch.
The definition of the environment is stored under My Documents/ Software AG/EntireX.
Choose Option 8 to start monitoring the environment you defined in the previous step. During execution, the definition of the environment will be passed.
Keyword BROKER checks if the defined broker can be accessed.
Keyword SERVICE checks if the defined (ACI) service is registered with the broker.
Keyword RPCSERVICE defines an RPC server. During execution this service will be "pinged" using the RPC ping command,
which checks if the defined service can be called.
If an outage or error occurs, the error exit you wrote is called.
The environment check is repeated after a specified time (default is 60 seconds).
The technical basis for all these checks is the command-line utility etbinfo.
Full details are provided under etbinfo in the Windows Administration documentation.
If the check of a component in your environment (BROKER, SERVICE or RPCSERVICE) fails,
the specified ERROREXIT is called and provides the following information:
the object (BROKER or SERVICE)
error number and error text returned by etbinfo
environment name
broker name and broker ID
if a service fails, the name, class, server and service
If an outage occurs, you can use this information to send a notification about the checked environment (using your defined environment name) and the component (broker or service) that is not available. Or you can try to automatically restart the component that is down.