
This document introduces Application Monitoring in EntireX and describes common scenarios that use this feature. It covers the following topics:
This feature is described in more detail in the separate Application Monitoring documentation.
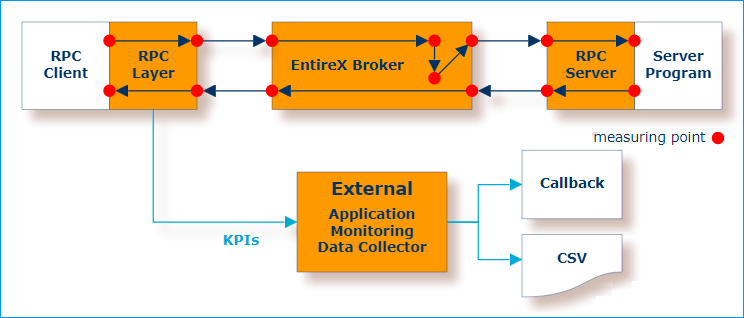
Application Monitoring is an EntireX feature that enables you to monitor the response times in your distributed applications, and it also enables you to monitor certain error situations. The heart of Application Monitoring is the EntireX Application Monitoring Data Collector, which collects the response time data of each involved software component of selected synchronous EntireX RPC services. The Application Monitoring Data Collector stores the KPI values in CSV (comma-separated values) files. The files can be processed by any third-party tool that supports CSV files, for example Microsoft Excel. Alternatively, you can hook in your own monitoring back end, using the callback user exit of the Data Collector.
When Application Monitoring is enabled, each call to the service by a client application is monitored. You can measure
overall service response times
network transport times
EntireX Broker processing
waiting times
RPC server processing times
You can also measure
time spent for database calls (if Natural and mainframe Adabas are installed on the back end)
time spent for DB2 calls (if applicable and depending on the platform)
Each Software AG enterprise product involved concatenates the monitored time(s) with the service call. When the call returns to the client, the client RPC runtime provides the event data to the Application Monitoring Data Collector.
For webMethods Integration Server scenarios, the Application Monitoring Data Collector is available inside the Integration Server. This section describes the following scenarios:
In this scenario, REST clients call into an RPC server via an IS service: inbound calls from the viewpoint of the webMethods Integration Server, or RPC server. The following diagram shows the KPI measuring points and flow when a REST client or IS service calls an RPC server.
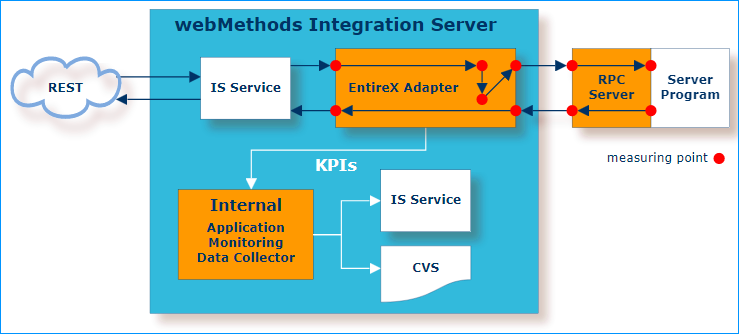
The KPI measuring points comprise the Integration Server and the RPC server.
In this scenario, REST clients call into the back end (CICS, IMS or AS/400) via an IS service: inbound calls from the viewpoint of the webMethods Integration Server, or back end. The following diagram shows the KPI measuring points and flow when a REST client or IS service calls the back end using an CICS ECI Connection, IMS Connect Connection or AS/400 Connection.
You can monitor the sum of the transport time to CICS ECI, IMS Connect or AS/400 plus the time spent in the CICS transaction, IMS transaction or AS/400 program.
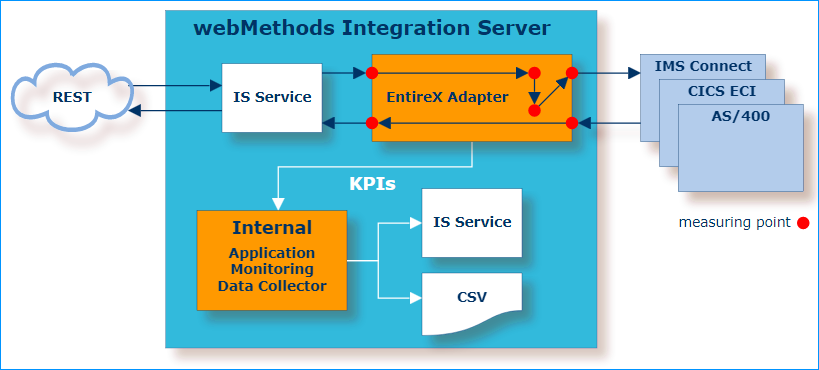
The KPI measuring points comprise the Integration Server.
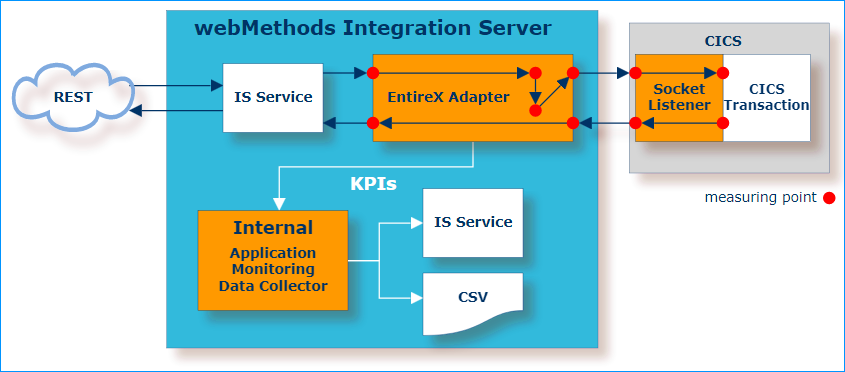
The KPI measuring points comprise the Integration Server and Socket Listener.
This scenario illustrates the opposite direction: outbound calls of an RPC client calling a REST service via an IS service. The following diagram shows the KPI measuring points and flow when an RPC client calls a webMethods IS service or REST API.
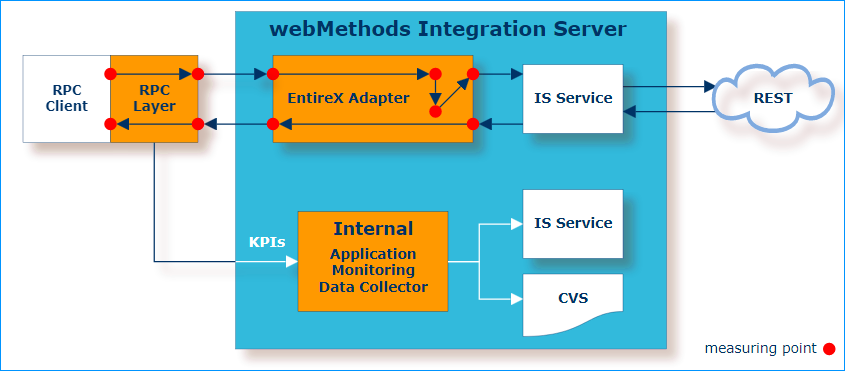
The KPI measuring points comprise the RPC client and Integration Server.
You can process your KPI data using the Application Monitoring Data Collector or an Integration Server service:
The Application Monitoring Data Collector collects the response time data of each involved software component of selected synchronous EntireX RPC services and stores the KPI (key performance indicator) values in CSV (comma-separated values) files. The files can be processed by any third-party tool that supports CSV files. For webMethods Integration Server scenarios, the Data Collector is available inside the EntireX Adapter.
See Application Monitoring in the EntireX Adapter documentation for configuration details.
As an alternative to storing the KPIs in CSV files, you can invoke an IS service. The monitoring KPIs can be consumed by an Integration Server service, and the monitoring data can be further processed.
There are also scenarios that do not use webMethods Integration Server, for example calls to/from web services or another RPC client through RPC server communication. Where EntireX Broker is the communication hub, the Application Monitoring Data Collector runs as a separate standalone component, often called the External Application Monitoring Data Collector.
RPC clients support Application Monitoring without additional configuration, including the EntireX Adapter with an EntireX RPC connection, which is technically an RPC client. So does an RPC server, including the EntireX Adapter with an EntireX RPC Listener connection, which is technically an RPC server.
With the External Application Monitoring Data Collector you can process your KPIs with any tool that supports CSV files or you can use the callback user exit of the External Data Collector:
cron daemon in a UNIX system, or a Windows service under the Windows operating system.
For more information see Setting up the External Application Monitoring Data Collector in the Application Monitoring documentation
As an alternative to storing the KPIs in CSV files, you can use the callback user exit of the External Application Monitoring Data Collector. Use this approach if you want to feed arbitrary monitoring back ends in real time.
 To use the callback user exit
Write a Java class that implements the DataCollectorCallback interface.
Make it known to the External Application Monitoring Data Collector.
For more information see Callback User Exit under Setting up the External Application Monitoring Data Collector in the Application Monitoring documentation.
The Application Monitoring Data Collector inside the EntireX Adapter and the External Application Monitoring Data Collector are interchangeable. You can use the Data Collector inside the EntireX Adapter for scenarios with the EntireX Broker and equally, the External Application Monitoring Data Collector for scenarios with the webMethods Integration Server.
Whatever architecture you choose, you can configure Application Monitoring dynamically while the EntireX Adapter or EntireX Broker is running. The change is effective immediately, and you do not need to restart the EntireX Adapter or EntireX Broker.
You can choose an Internal Application Monitoring Data Collector (recommended) or an External Collector.
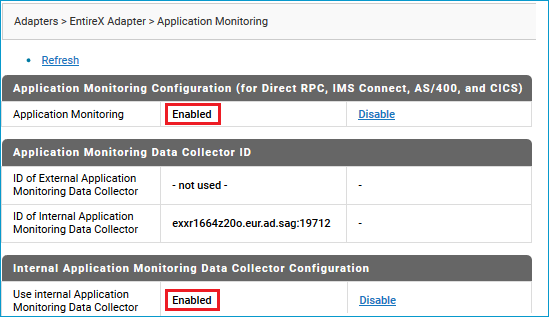
To configure the Internal Application Monitoring Data Collector in EntireX Adapter dynamically
In the webMethods IS Administration GUI, choose > > .
Enable Application Monitoring.
Enable Use internal Application Monitoring Data Collector.
The collector runs as a server in the Direct RPC component and is started and stopped automatically when the Direct RPC component is started or stopped.
External Collector
Alternatively, the monitoring KPIs can be routed to an External Application Monitoring Data Collector, using either
a collector running internally within Direct RPC in a different instance of Integration Server, or
a collector pre-started as a service, as described under External Application Monitoring Data Collector above.
Configuring the External Application Monitoring Data Collector in EntireX Broker scenarios depends on the platform the broker is running on:
UNIX and Windows
Use the Command Central GUI or command-line interface.
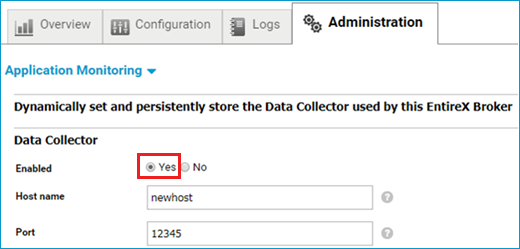
GUI
Choose > and enable Data Collector.
See Changing the Application Monitoring Settings Dynamically under Administering EntireX Broker using the Command Central GUI.
Command Line
See Changing the Application Monitoring Settings Dynamically under Administering EntireX Broker using the Command Central Command Line.
z/OS
See Application Monitoring-specific Commands in the z/OS Administration documentation.