Using Smart Mapping
Designer provides the Smart Mapping functionality under the Pipeline view for MAP and INVOKE steps to simplify the mapping between the pipeline variables. You can use the Smart Mapping for flow services that provides the following capabilities.

Automatic prediction:
Designer displays the predictions while mapping the pipeline data between input and output variables. You can use the suggested mappings to create a link between variables easily while working with a flow service.
Probability-based predictions:
Designer displays the mapping predictions based on the likelihood of the input and output variables. This enables you to select the mappings effortlessly.
Tenant specific predictions:
Designer connects to
webMethods Cloud Container that uses a Machine Learning (ML) algorithm to suggest the predictions. This algorithm provides suggestions to map similar fields according to the mappings of the tenant. You can choose to connect to different cloud connections to obtain different mapping predictions.
Consider the following when you build a Smart Mapping:
Designer connects to the default
Cloud Container connection to provide the mapping predictions. If this connection is inactive or does not support
Smart Mapping,
Designer does not show mapping predictions in the
Pipeline view.

To use
Smart Mapping1. In the Package Navigator view, open the flow service.
2. In the editor, select the INVOKE or MAP step for which you want to use Smart Mapping.
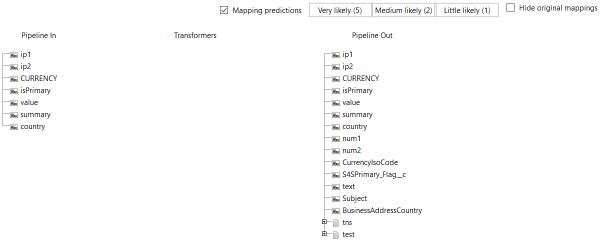
3. In the Pipeline view, enable smart mapping by selecting the Mapping predictions checkbox.
To hide the original mappings, select the Hide original mappings checkbox.
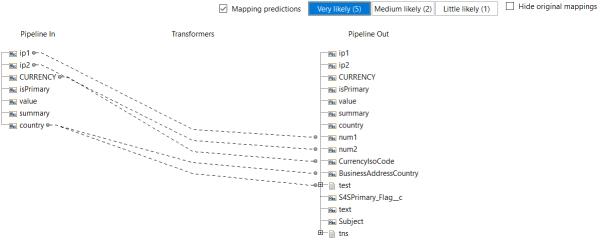
4. The mapping prediction includes the following levels based on their mapping likelihood.
Very likely: Displays the highest probability.
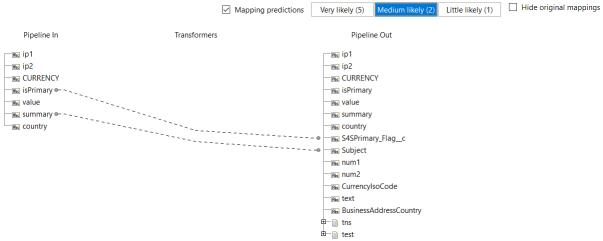
Medium likely: Displays the medium probability.
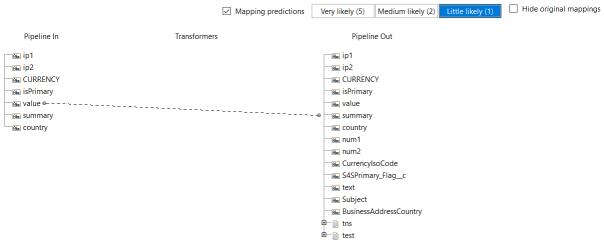
Little likely: Displays the lowest probability.
You can select a prediction and view the properties under the Properties window.
Note:
If no mappings are available for the pipeline input in Cloud Container, Designer does not display any mapping predictions.
5. For the predictions under each category, you can perform the following actions:
a. You can click Very likely, Medium likely, or Little likely mapping predictions to see the recommendations between the pipeline data.
b. To accept a prediction, select and right-click the recommendation line, and click Select suggestion(s).
Click Accept selected in the upper-right corner. You can alternatively click Accept All to select all the recommendations.
Note:
You can also undo the operation using the Edit > Undo command.
6. When the mappings are completed, save all your changes using the File > Save All or Save command.