Viewing Trading Networks KPIs
The instructions below provide a general overview of viewing the data. For complete information about the Analytics Overview page, the KPI Summary page, and the KPI Instance Detail page, see webMethods Optimize User’s Guide .

To view
Trading Networks KPIs using BAM
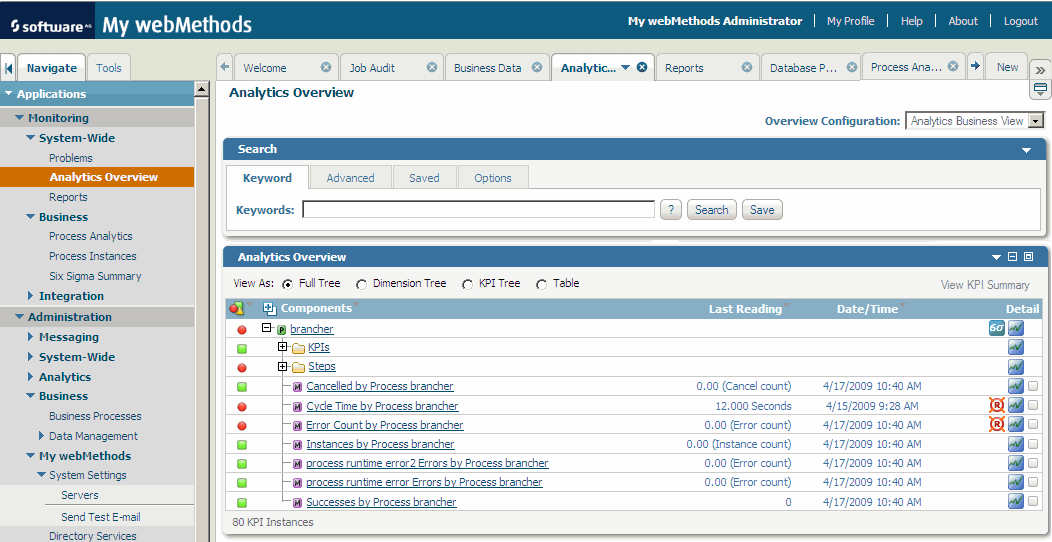
1. In My webMethods, select Navigate > Applications > Monitoring > System-wide > Analytics Overview.
The Analytics Overview page displays. This page enables you to select KPIs and view more information about them on the KPI Summary page. The Status column to the left of each component in the Analytics Overview panel indicates its current status. Additional icons beside each component indicate whether that component is a KPI, KPI instance, or dimension.
You can drill down into each KPI to view the KPI Summary or the KPI Instance Detail page.
Sample Analytics Overview page
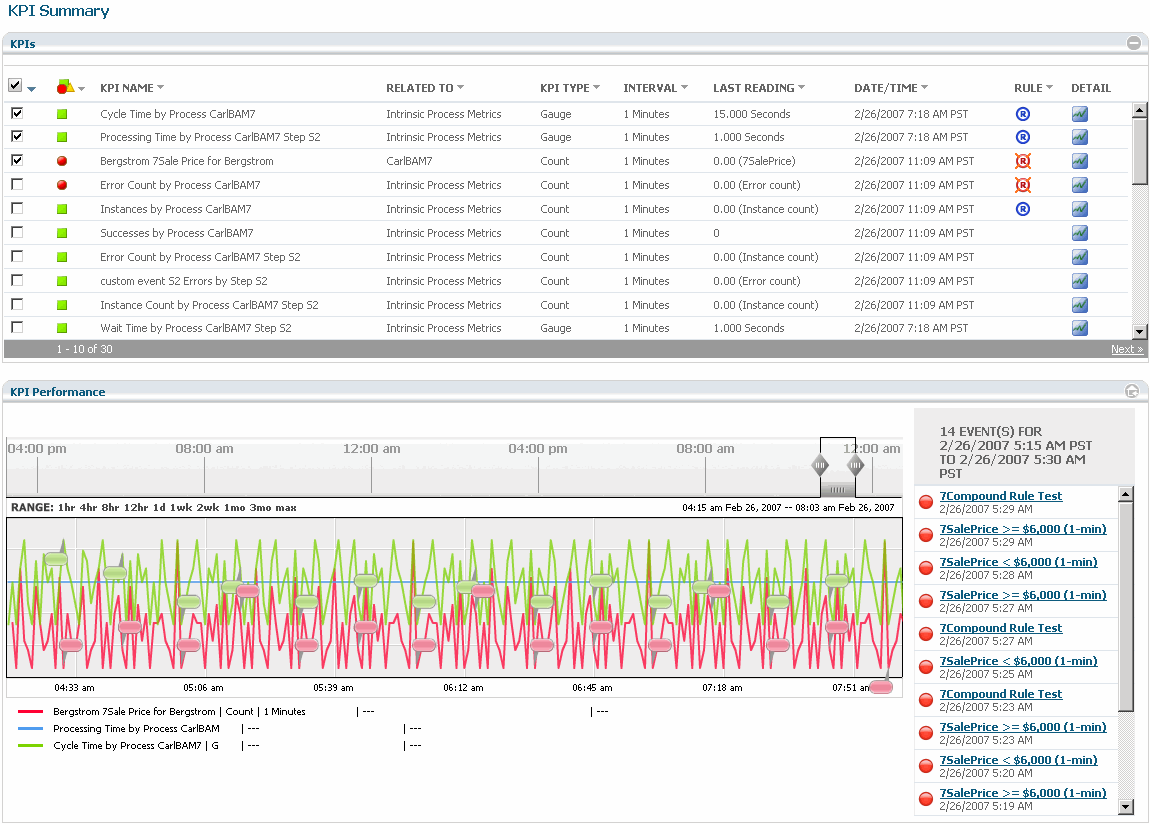
2. To view more information about one or more KPIs, select the check box in the Detail column next to each desired KPI instance, and then click the View KPI Summary button.
The KPI Summary page is displayed. This page displays a list of all KPI instances associated with the selected item. Until you select KPI instances, the KPI performance chart is blank.
Tip:
The component you select determines which KPIs display on the KPIs panel. To see all the instances of a KPI, select it on the Analytics Overview page.
Sample KPI Summary page
3. View or edit detail information for a KPI instance, as desired, by clicking an event map name or KPI name.
4. To view the data collected for a KPI instance, click its  Monitor.
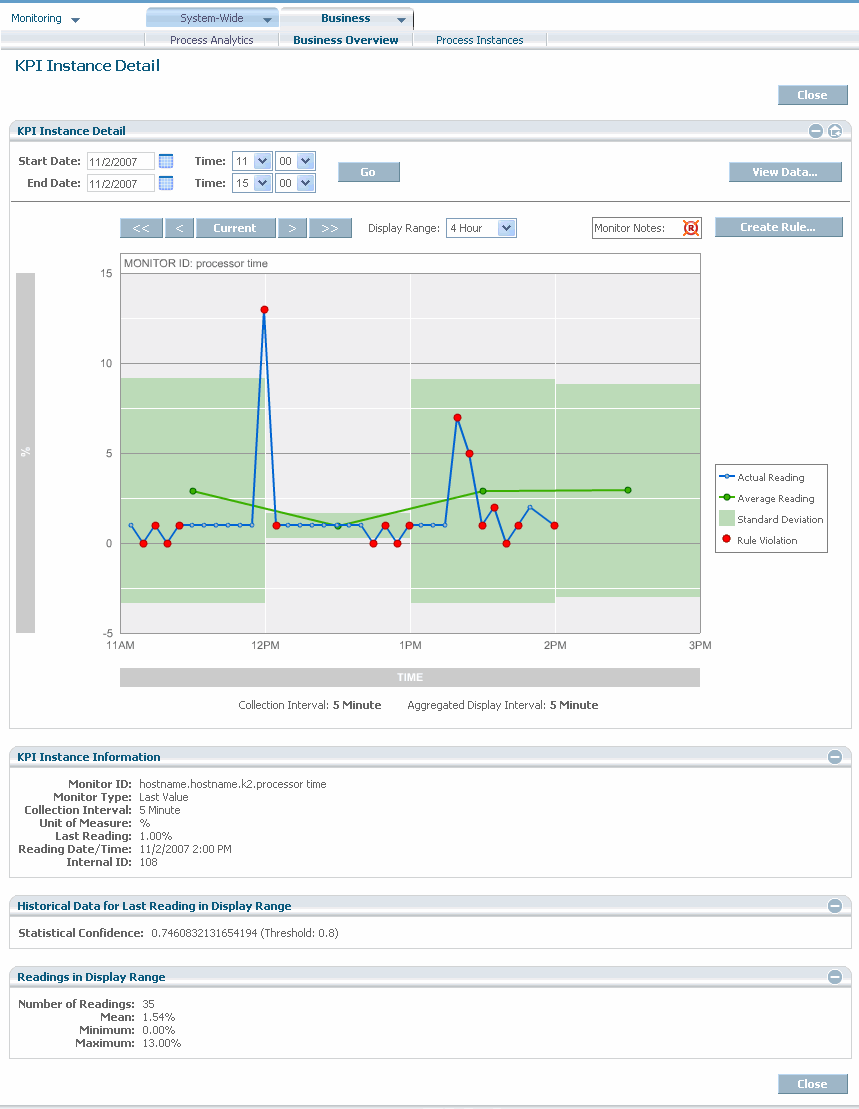
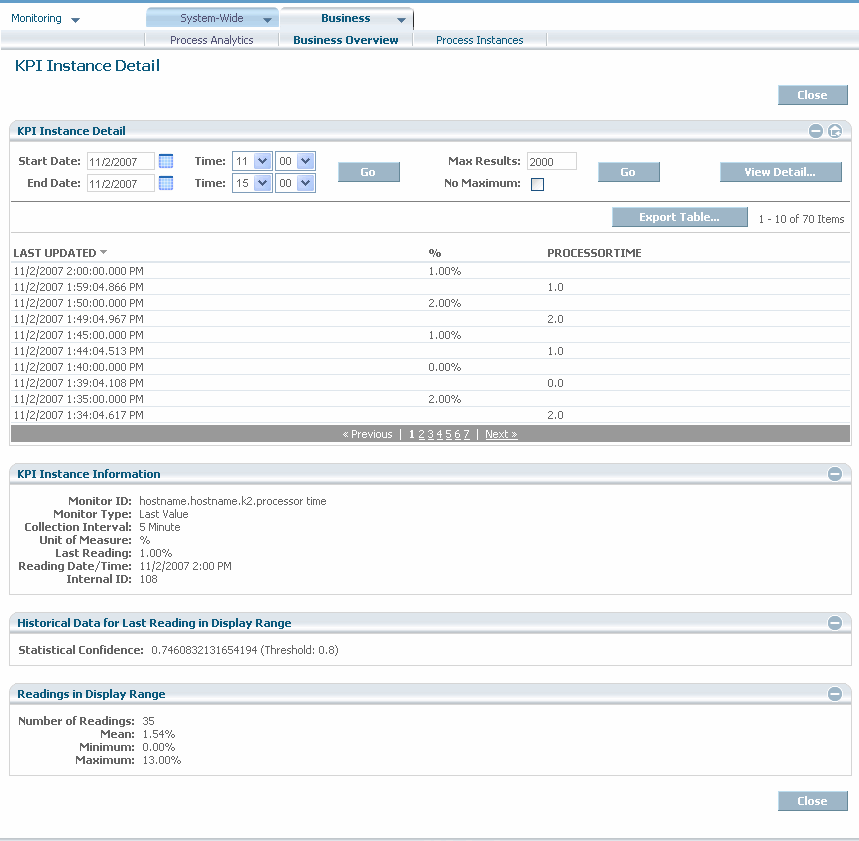
 The KPI Instance Detail page displays data for a KPI instance over any time period you request. The default is the most recent four-hour period. You can view the individual data points of a KPI instance in graphical or tabular format. You can also aggregate the monitors to view the historical average values of the KPI instances, or view data based on a time period. Examples of both formats appear below.
For complete information about viewing data points and events for KPIs, see webMethods Optimize User’s Guide.
KPI Instance Detail graph page


