About Debug View
When debugging a service, Designer displays the debugging progress and the flow service editor (including the flow step that is about to be executed) in Debug view. Keep the following information in mind when looking at Debug view while debugging a flow service:

For each launch configuration that you use to debug a service, Debug view contains a launch configuration stack frame.
The launch configuration stack frame contains an
Integration Server thread stack frame. The launch configuration can appear in the Debug view multiple times, once for each debug session.
The
Integration Server server thread stack frame contains the service thread stack frame.
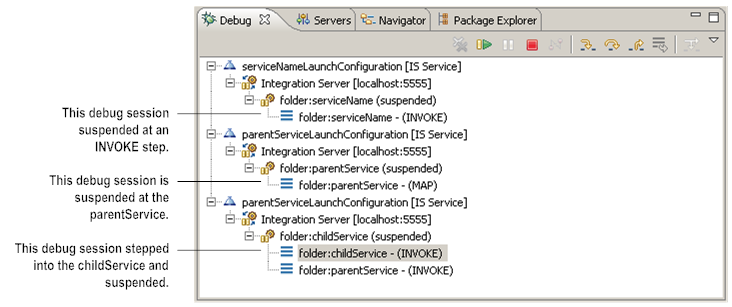
If a debug session is suspended, the service thread stack frame displays “(suspended)” after the service name.
The service thread stack frame contains the name of the flow service and the step at which the debug session is suspended.
If you stepped into a child INVOKE service or into a transformer in a MAP step, Debug view displays the parent service (and its flow step) and the child service (and its flow step) under the service thread stack frame.
Designer displays the child service above the parent service because the child service is at the top of the call stack structure.
Designer highlights the child step at which the debug session is suspended. Variables view displays the contents of the pipeline that will be passed to the child service.
If you stepped into a MAP step to invoke a transformer, under the service thread stack frame,
Designer displays MAPINVOKE before
Designer executes the transformer.
Designer displays MAPCOPY right after the service executes but before
Designer executes the links from the transformer to the variables in
Pipeline Out.Debug view with three debug sessions