Viewing Information for a Cluster
You can view information for an individual cluster by expanding the Clusters node in the navigation pane and selecting the node for the required cluster. The view provides an overview of the characteristics as well as current status of a selected cluster.
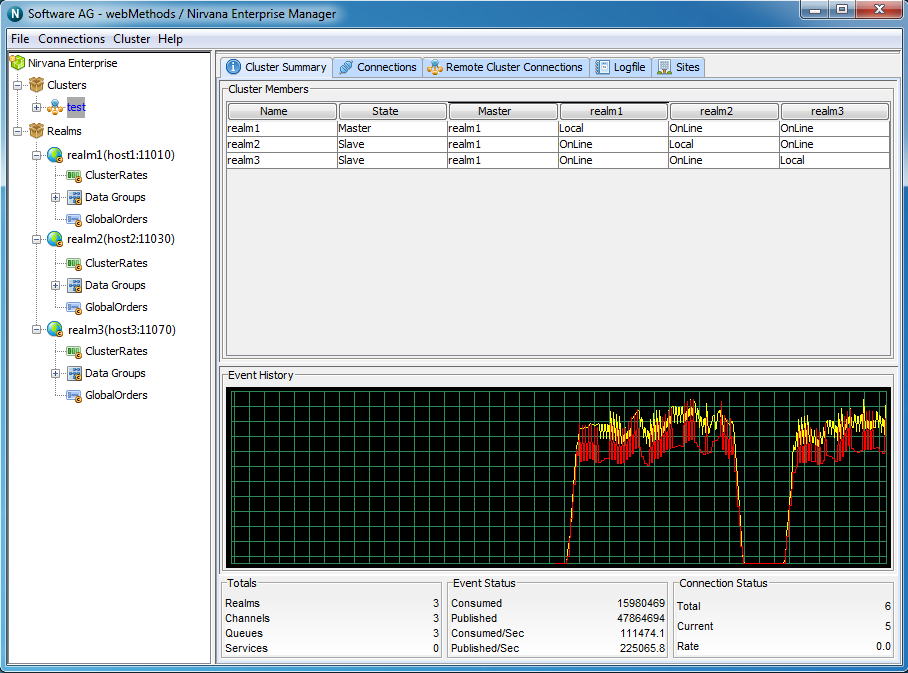
View of a Cluster
The top of the view shows the realms that have been defined for the cluster.
The view includes a real time graph illustrating the total number of events published (yellow) and consumed (red) across all realms in the cluster.
The bottom of the screen displays 3 panels named Totals, Event Status and Connection Status. These panels and the information displayed are described below.
Totals
The Totals section describes the following :
 Realms
- The number of realms within the cluster
 Channels
- The number of channels that exist across all realms within the cluster
 Queues
- The number of queues that exist across all realms within the cluster
 Services
- Total number of services that exist across all realms within the cluster
Event Status
The Event Status section describes the following :
 Published
 - The total number of events published to all channels, queues and services across all realms within the cluster
 Consumed
 - The total number of events consumed from all channels, queues and services across all realms within the cluster
 Published/Sec
 - The number of events published to all channels, queues and services, per second across all realms within the cluster
 Consumed/Sec
 - The number of events consumed from all channels, queues and services, per second across all realms within the cluster
Connection Status
The Connection Status section describes the following :
 Total
Total - The total number of connections made to all realms within the cluster
 Current
 - The current number of events across all realms within the cluster
 Rate
Rate - The number of connections being made per second across all realms within the cluster
The Enterprise Manager provides information for the cluster through the following tabs:

Cluster Summary

Connections

Remote Cluster Connections

Logfile

Sites
Cluster Summary
The Cluster Summary tab provides an overview of all realms in the Cluster. It identifies the current Master realm, and also shows each realm's perception of the state of all other realms.
The Cluster Summary Tab
Connections
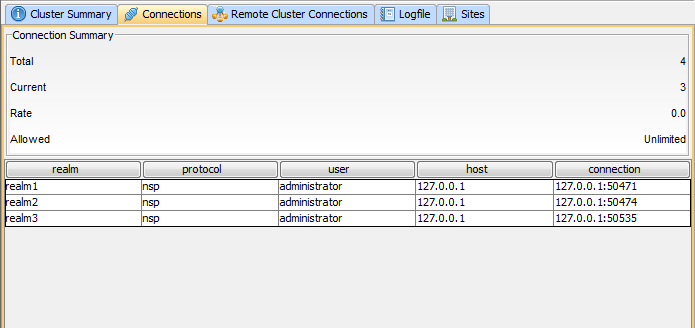
The Connections tab shows all connections to realms in the Cluster. In this example, it shows a single user connected to three realms in the Cluster:
The Cluster Connections Tab
Remote Cluster Connections
The Remote Cluster Connections tab shows all remote cluster connections for this Cluster. Clusters can be remotely connected together providing the ability to create joins between channels in different clusters:
The Remote Cluster Connections Tab
Logfile
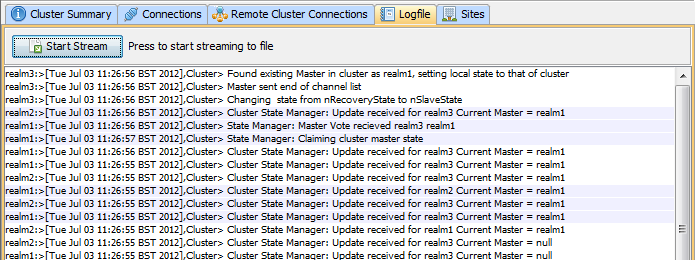
The Logfile tab shows a real-time Cluster-specific log, and provides the option to stream the log output to a file:
The Cluster Logfile Tab
Sites
The Sites tab shows any site configurations (see
Creating and Managing Clusters with Sites) for the current cluster. Clusters that have Site configurations are known as
Universal Messaging Clusters with Sites. (Those without are known as
Universal Messaging Clusters):
The Cluster Sites Tab


