Running Business Processes and Composite Applications 10.4 | Running Business Processes and Composite Applications | webMethods Integration Server Administrator’s Guide | Debugging Service Exceptions Using the Error Log | Interpreting the Error Log
 
Interpreting the Error Log
 
Understanding the Service Stack
Understanding the Error Messages
Understanding the Stack Trace
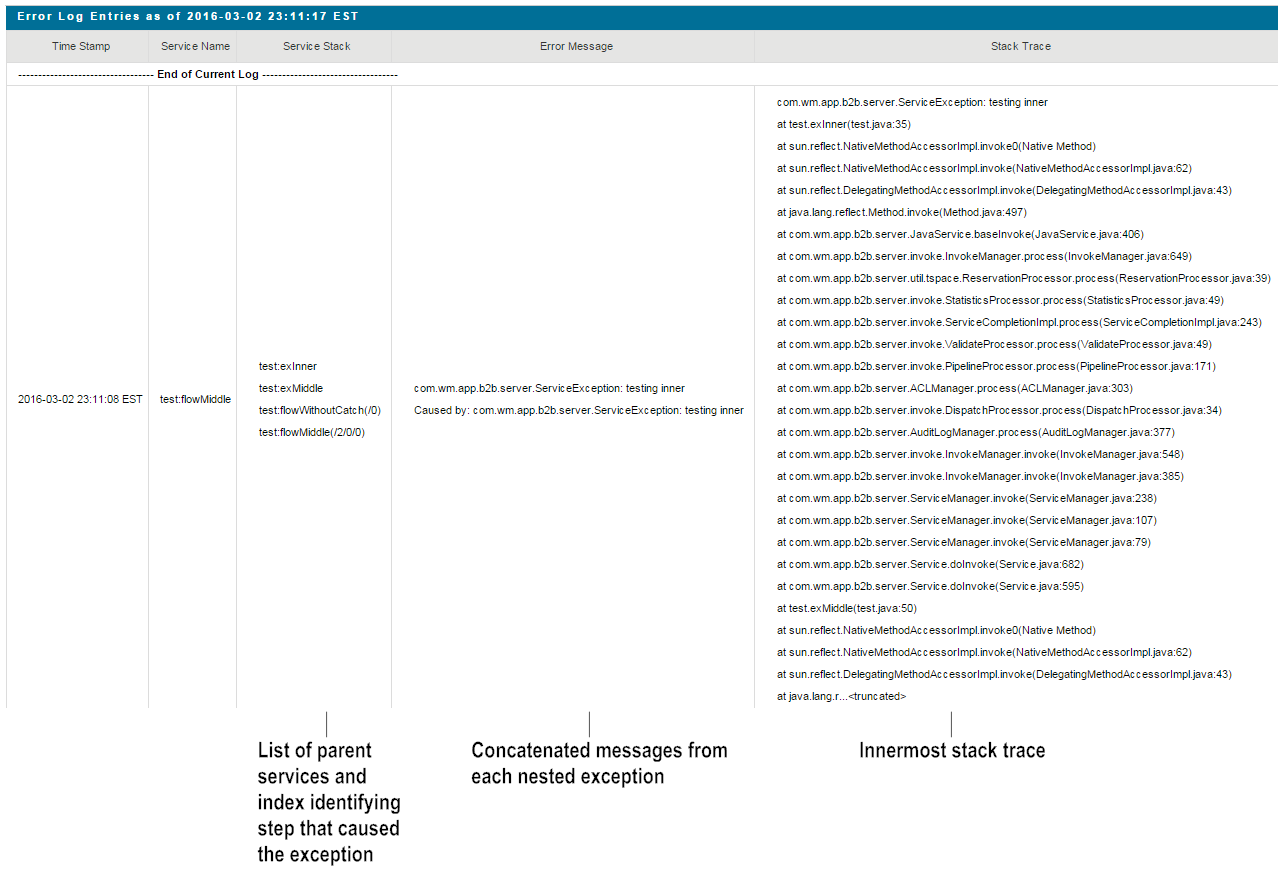
The following image shows a portion of the error log that includes details that help you identify which step caused an exception. The Integration Server Administrator displays these details when you perform two actions:
*Set the value of the watt.server.deprecatedExceptionLogging parameter to its default setting, false.
*Select the Expand Stack Trace Data check box on the Logs > Error page.
Integration Server error log showing detailed exception logging.
Copyright © 2019 | Software AG, Darmstadt, Germany and/or Software AG USA, Inc., Reston, VA, USA, and/or its subsidiaries and/or its affiliates and/or their licensors.
Innovation Release