Viewing the Process Engine Dashboard
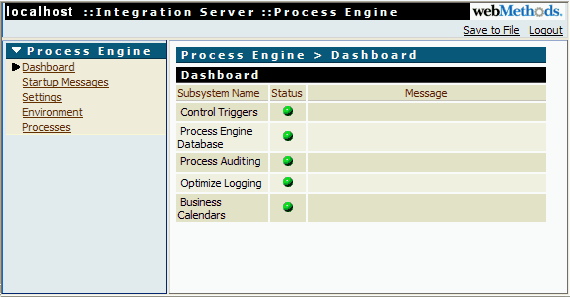
The Dashboard page, shown below, provides you with basic status information for Process Engine subsystems.

To view the Dashboard page
2. Click Dashboard.
The following table lists and describes the three possible statuses.
Icon | Status |
| Running and in a normal condition. |
| An optional component that is not configured. See the Message column for further information. |
| A required component that is either not configured, has been configured but is not currently running, or is configured incorrectly. See the Message column for further information. |
3. If you encounter yellow or red status icons, refer to the other available page links to look for more information, such as Startup Messages, Settings, and Environment.
