Group and Analyze Rows
To analyze the data in a dataset stream you can use the Group By clause or the Over clause. Group By, as in SQL, categorizes rows into sets based on the unique values of one or more columns. The analysis then is performed on each group defined by the analytic function(s) that are used in the query’s Select clause.
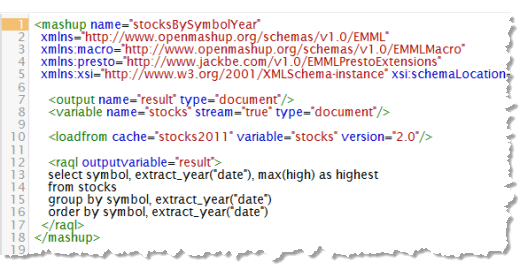
In this example, we group the stocks dataset that was stored in an In-Memory Store in the previous section and determine the highest price for each stock symbol in each year. This mashup uses <loadfrom> to retrieve the stock dataset stream from the in-memory store and then issues the RAQL query.
The Group By clause uses a list of column expressions to determine how rows are grouped. This can be as simple as one column, although it is quite common to group by two or more. Unique values from the combination of columns then determine which group a given row belongs to.
This query uses the plain function extract_year() to extract the year for each row from the date column and the max() analytic function in the Select clause to discover the highest price for all rows in each group. Because Group By returns a single row for each group, you must use aggregate analytic functions which perform calculations for all values in the current scope (group in this case) and return a single value.
Note: This is also an example of escaping column or other names that conflict with
RAQL reserved words. In this case, the
date column name is a conflict, so the name is enclosed in quote marks. See
RAQL
Reserved Keywords for a list.
RAQL has a set of built-in analytic functions that you can use in Group By clauses, or you can write and add your own analytical functions. See
Built-In
RAQL
Functions for more information.
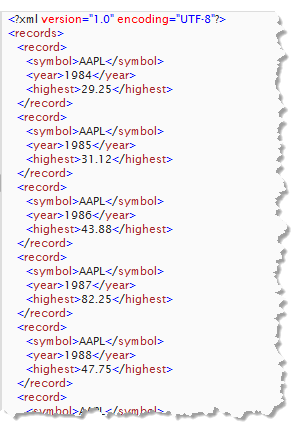
The results of this query using Group By, shown here, contain one row for each symbol + year combination:
The complete EMML for this mashup is:


