Implementation - Table diagram
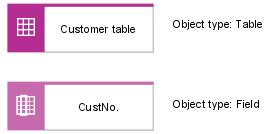
The table diagram is used to describe the tables and fields of a database system. The following figure shows a graphical representation of tables and fields.
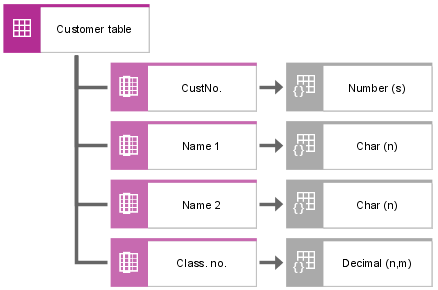
The individual fields assigned to this table can be shown for each table. For further specification, a sorting index and the domain can be assigned to each field. The following figure illustrates an example.
Multilateral relationships between tables and relations or entity types may occur. These relationships can be illustrated in the table diagram by selecting the relevant connections.
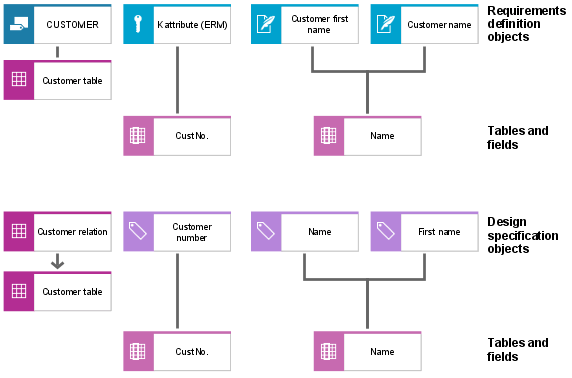
Due to the fact that converting or documenting database tables and fields used in a company does not necessarily require the definition of a relational schema, both the realization relationships between relations (or attributes) and tables (or fields) and between entity types (or ERM attributes) and tables (or fields) can be represented.
The representation may focus either on the relations and attributes realized by the tables and fields, or - leaving out the relational definitions – on the entity types, relationship types, and ERM attributes illustrated by the tables and fields. Both types of representation are illustrated in the following figure.
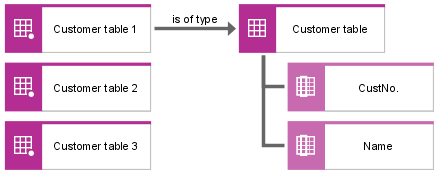
To be able to define the exact location of specific tables and fields in a company, it must be possible to define every single specimen of a table. The same applies when the privileges for accessing tables and fields are to be specified for organizational units. The Table object type introduced earlier determines the logical structure of a physical table and its fields at the Type level. However, multiple specimens of every table thus defined may exist on different media or at different locations in a company. This fact can be represented using the Table (specimen) and Field (specimen) object types.
With the help of these objects, the specimen count of a table or a field can be determined exactly. The following figure shows this aspect.
A list of objects and relationships that are available in a table diagram is provided in the ARIS Method Reference manual on your installation media.


