Understanding the Process Instances Dashboard
The Process Instances dashboard displays detailed information about the instances of the process that were active during the selected time range.
Process Volume and Cycle Time
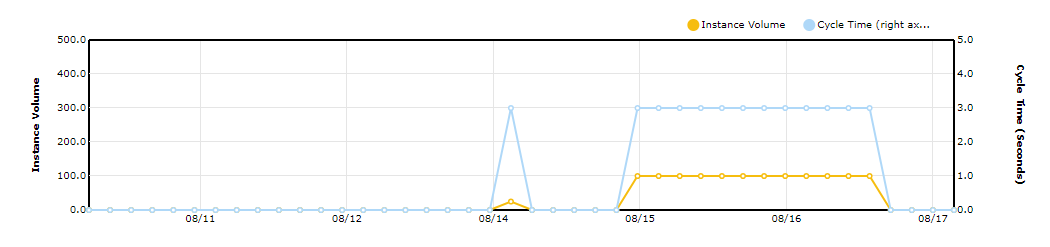
The graph in this panel plots process volume and average cycle time for the selected time range.
When viewing this panel, be aware that:

Each point in the
Instance Volume series reports the number of process instances that
completed during the given interval.
Each point in the
Cycle Time series reports the average cycle time for the given interval.
You can toggle the graphs on and off individually by clicking the series name in the legend.
You can display the time and exact measurement for a given data point by hovering over the point with your cursor.
The time displayed for a data point represents the end of the interval. For example, if you are viewing the graph for a
1 day time range (which reports measurements at hourly intervals), the data point at 2:00 represents the measurement for the interval 1:00:00:001 to 2:00:00:000 (inclusive).
Process Instances
The Process Instances table displays detailed information about instances that were active during the selected time range.
You can use the filtering options above the table to choose the set of process instances you want to view.
The following table provides more information about the four filtering options.
Select | To display |
Total | All instances in the time range (in any state). |
Started | All instances that began during the time range. |
Running | All instances that were still in progress at the end of the time range. |
Completed | All instances that ended (successfully or not) during the time range. |
Note: The table can display details for up to 2000 process instances. If your selection produces more than 2000 results, try filtering the instances using the buttons above the table or adjusting the time range.
The following table provides information about the columns.
Column | Description |
Last Updated | Time of the last process-control event for the instance (for example, step start, step end, stage start, stage end). |
Instance ID | The process instance ID. Click on the ID to view the Optimize Process Instances Detail page with additional information on this process instance. |
Start Date and Time | Time when the instance began. |
Ver | The deployment version of the model that defines this process. |
Status | The state of the instance at the end of the time range. This column displays: Running if the instance was in progress at the end of the time range. Completed if the instance ended (successfully or not) during time range. |
Cycle Time | The duration of the instance (shown for completed instances only). |
Actions | Actions you can take for this instance. Click the email icon  and complete the provided email form to send details about the stage instance to other interested parties. Click the Escalation icon  and complete the provided form to create an escalation action event. |
Click

and specify search criteria to filter the instances in the result table.