The Business Process Dashboards
The Business Process dashboards display summary metrics, instance detail, and other performance information about business processes that are under analysis by Optimize. These dashboards are displayed in webMethods Business Console.
There are two primary dashboard use case scenarios as described below.

For authorized users who have access to
My webMethods, including the
Optimize Analytic Engine, the dashboards can be used to view business process data. In this scenario, the dashboards enable the users to view process metrics, and to generate Email notifications or Escalation events. This scenario does not include the infrastructure to create a closed loop process that creates and assigns tasks related to Escalation events, unless users create a custom solution to implement such functionality.
Authorized users who have purchased and installed the appropriate
Software AG components can take advantage of a true closed loop solution. Using this type of solution, dashboard users can observe issues on the dashboards and can create escalation actions that are assigned to other users.
For both use case scenarios, the list of available dashboards is as follows.
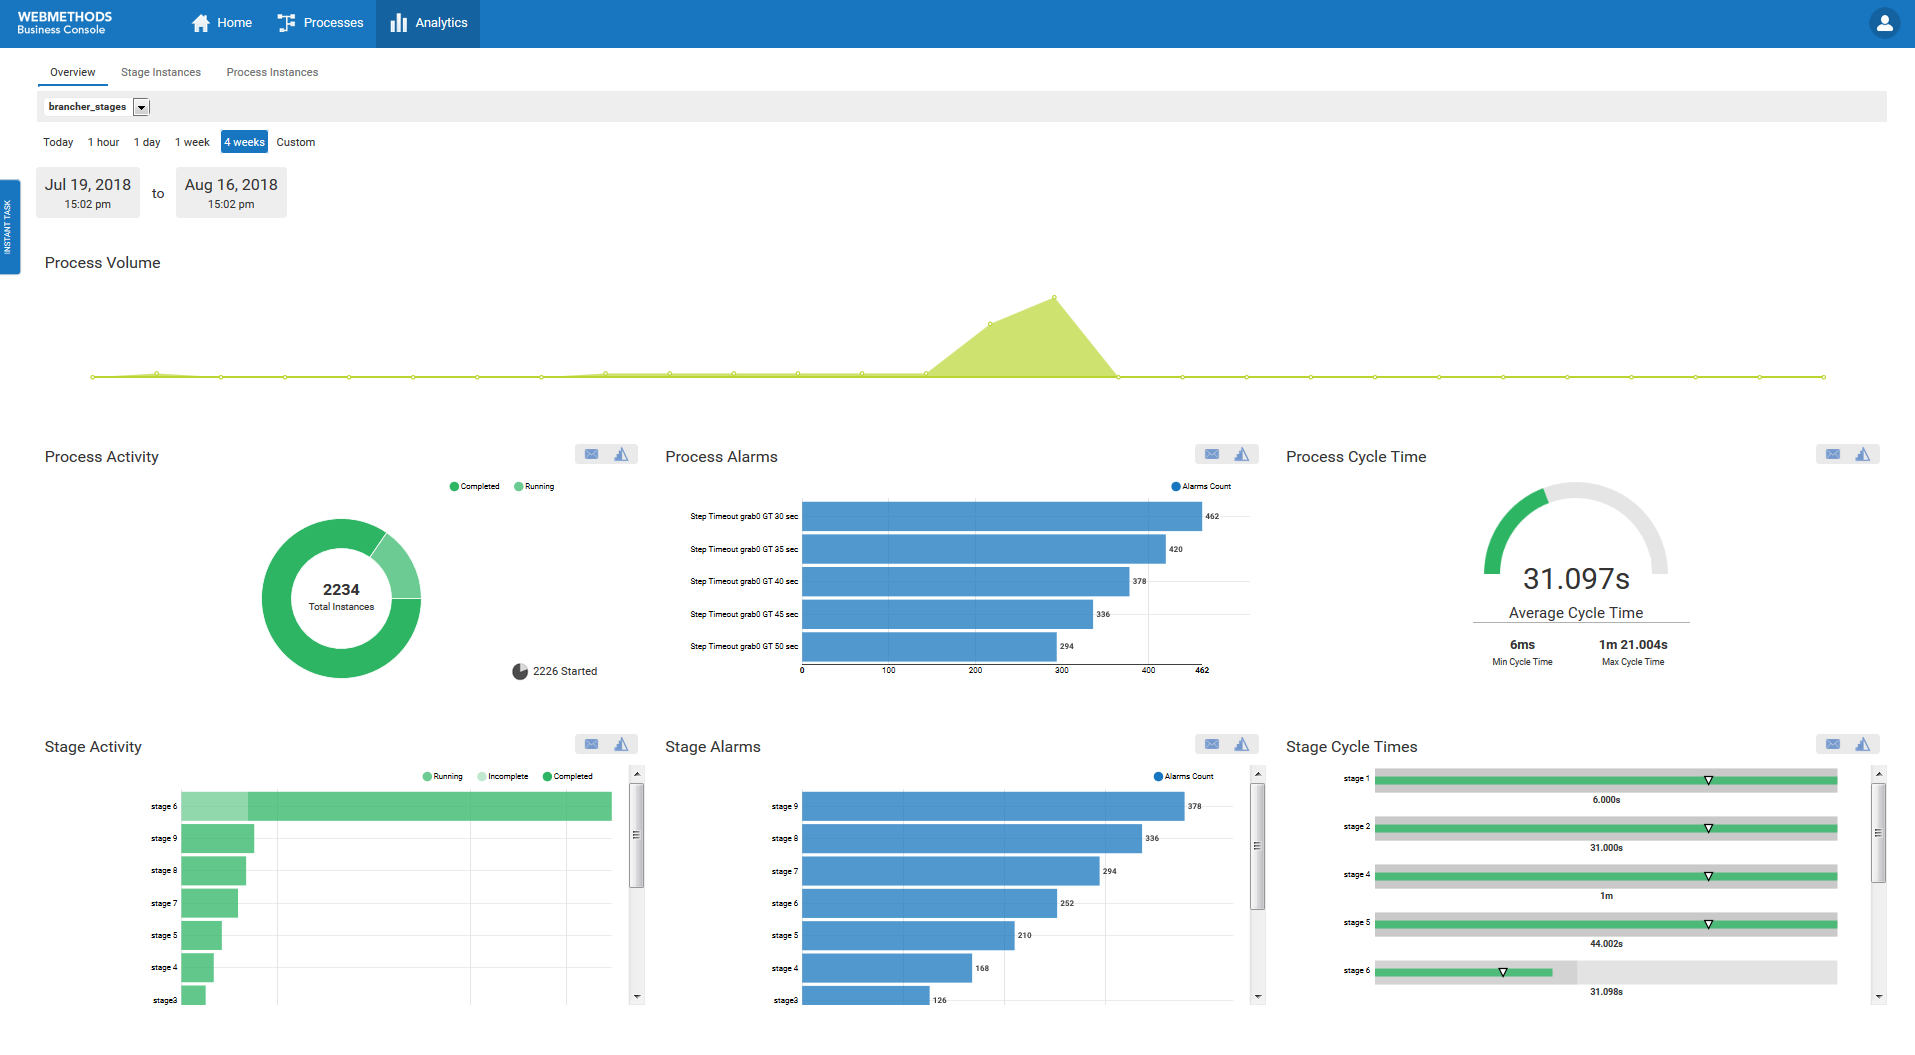
Process Overview Dashboard - This dashboard provides high-level information about a selected process including intrinsic metrics, historical views, and normality comparisons across a specified time range. This dashboard helps users to quickly identify potential issues, obtain information about alarms and stage activity, and use email or escalation actions to share findings with others.
Stage Instances Dashboard - This dashboard shows stage activity and performance for a process across a specified time range. The top of the page shows metrics about each stage, including information about activity, cycle time, and alarms. Selecting one or more table rows reveals information about individual stage instances and enables users to send email notifications or escalation actions for individual stage instances.
Process Instances Dashboard - This dashboard shows process activity and performance across a specified time range. A chart at the top of the page displays historical information about process volume activity and cycle time performance. A table at the bottom of the page shows individual process instances and enables users to send email notification or escalation actions for individual process instances.