Using the Dashboard
The Integration Server Administrator contains a Dashboard to display key system and server metrics in an easy-to-read format. The comprehensive dashboard helps you monitor system status, health, usage patterns and overall performance of Integration Server. The Dashboard includes metrics that are available on the Server > Statistics page as well as many other metrics.
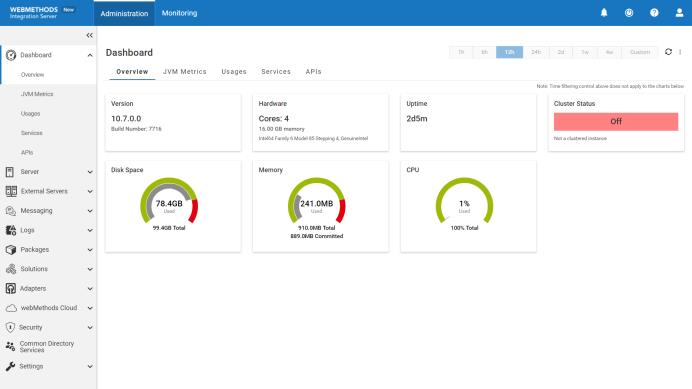
The Dashboard uses the following tabs for the different categories of metrics.

Overview
JVM Metrics
Usages
Services
APIs
The data on the dashboard is for the time period that you select. You can select from the one of the predefined time periods that are displayed at the top of the Dashboard or set your own using the Custom command.
The dashboard uses charts and tables to display the metrics. You can customize the tables to display the columns of interest.