How do I inspect failed runtime requests using tracer?
This use case starts when you want to inspect the failed runtime request and ends when you debug and troubleshoot the failed API requests.

To inspect the failed runtime request
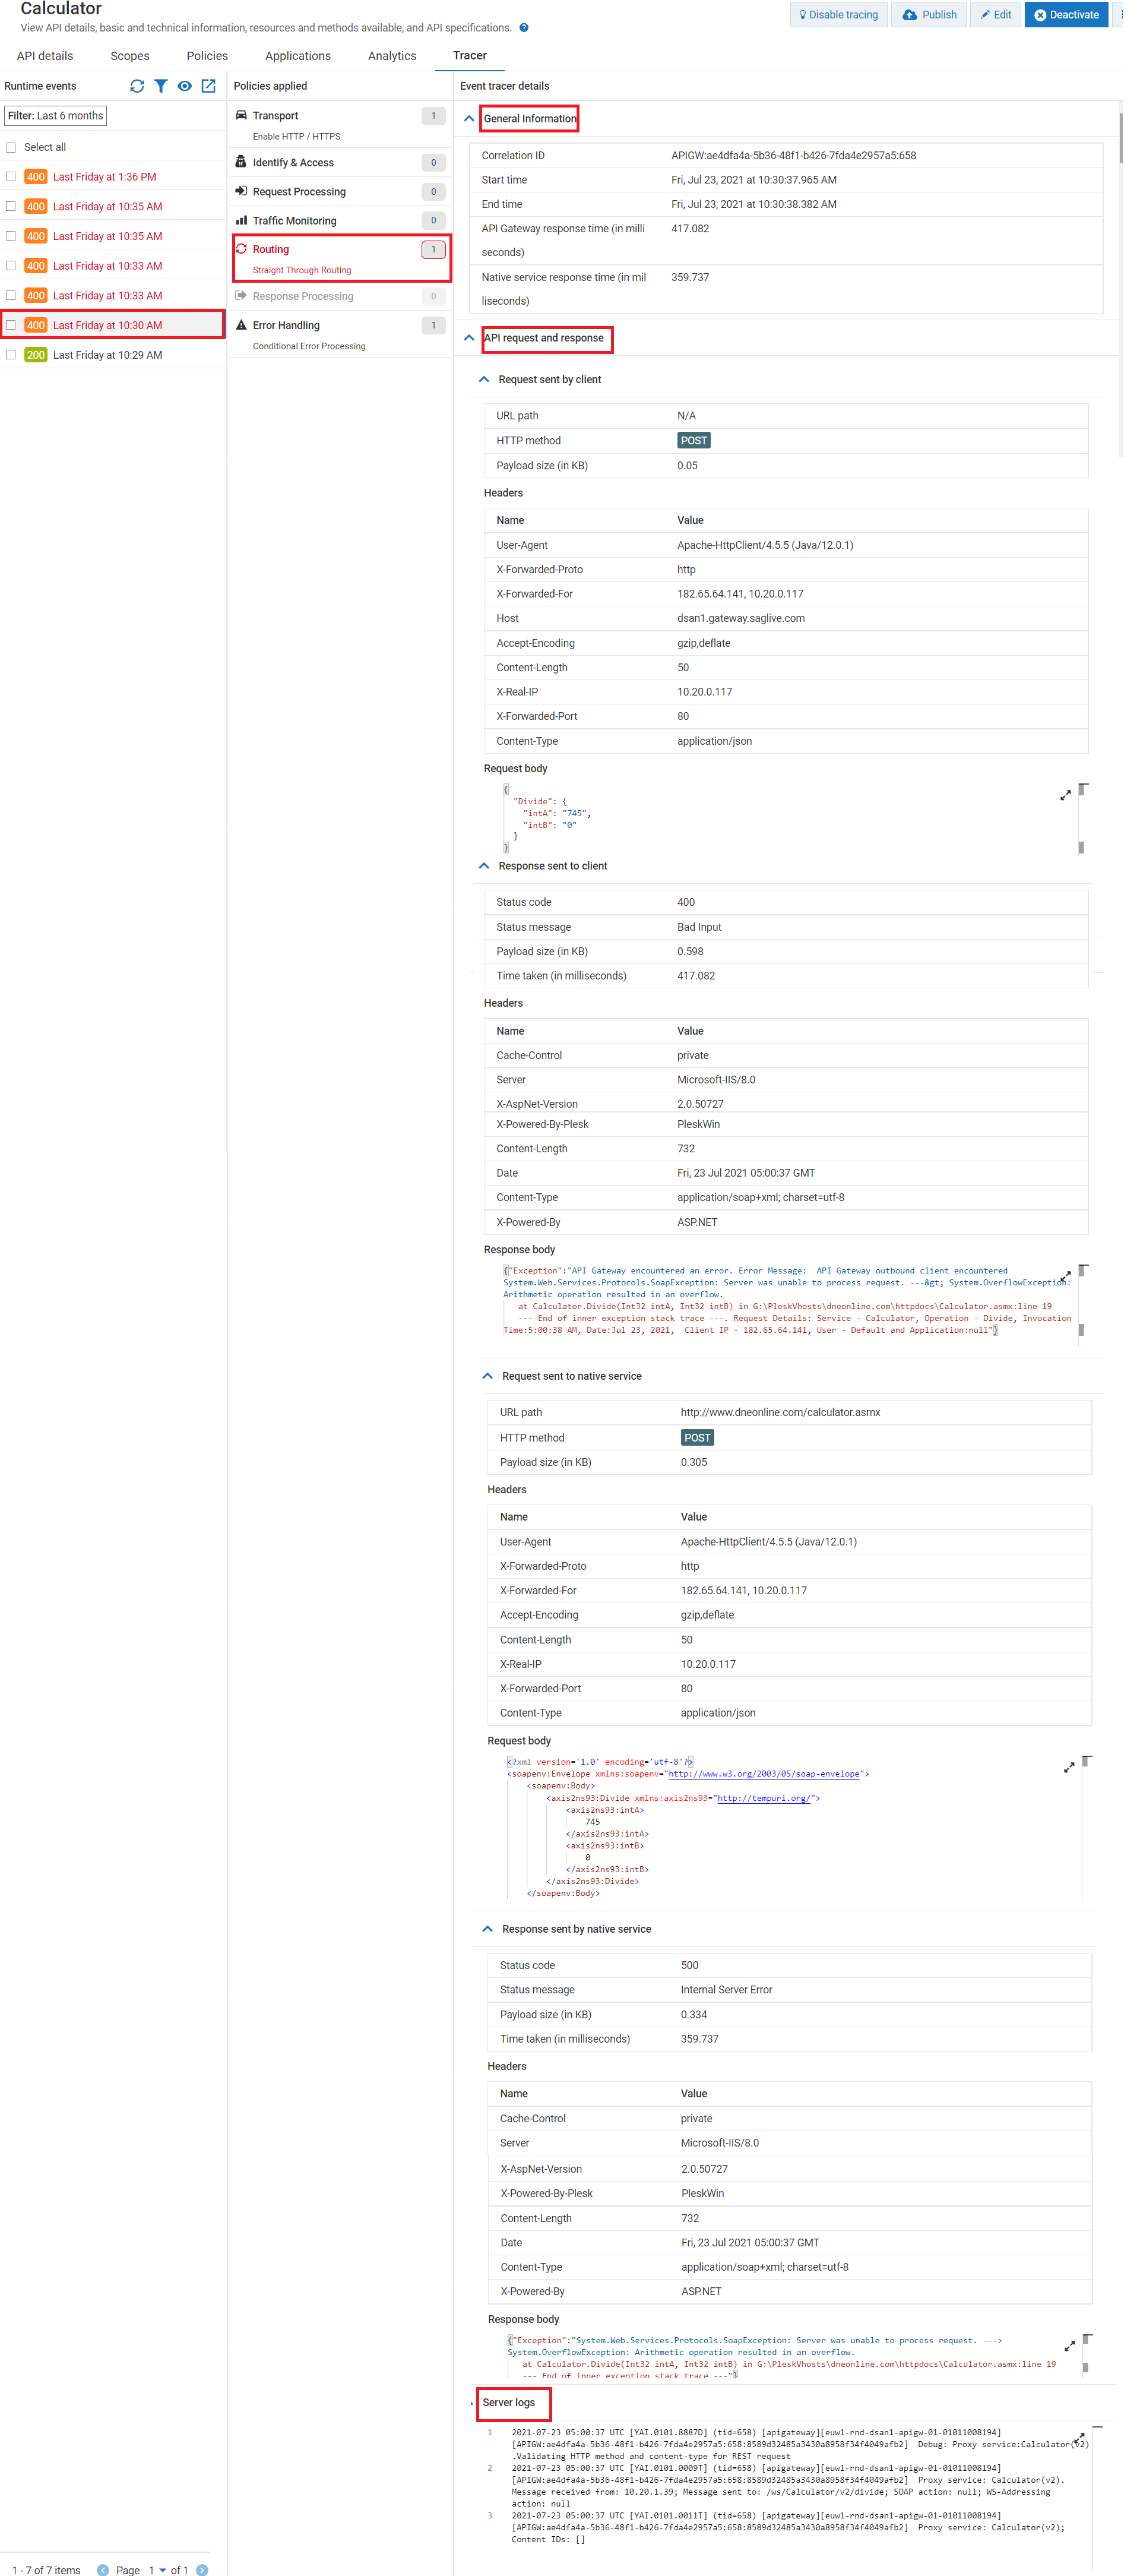
1. In the Runtime events section, click the client request for which you want to inspect the trace details.
The Trace API page refreshes and populates data in the Policies applied and Event tracer details sections. By default, the Event tracer details section displays the General Information, API request and response, and Server logs sections. Under the API request and response section, you have the following sub-sections:
 Request sent by client
 . Displays the request headers and request body sent by the client to API Gateway.
Response sent to client. Displays the response headers and response body sent to the client from API Gateway.
Request sent to native service . Displays the request headers and request body sent to the native API from API Gateway.
Response sent by native service. Displays the response headers and response body sent by the native API to API Gateway.
Note:
If the request and response body has streaming content, the tracer does not capture the streaming content even if you have enabled the tracer.
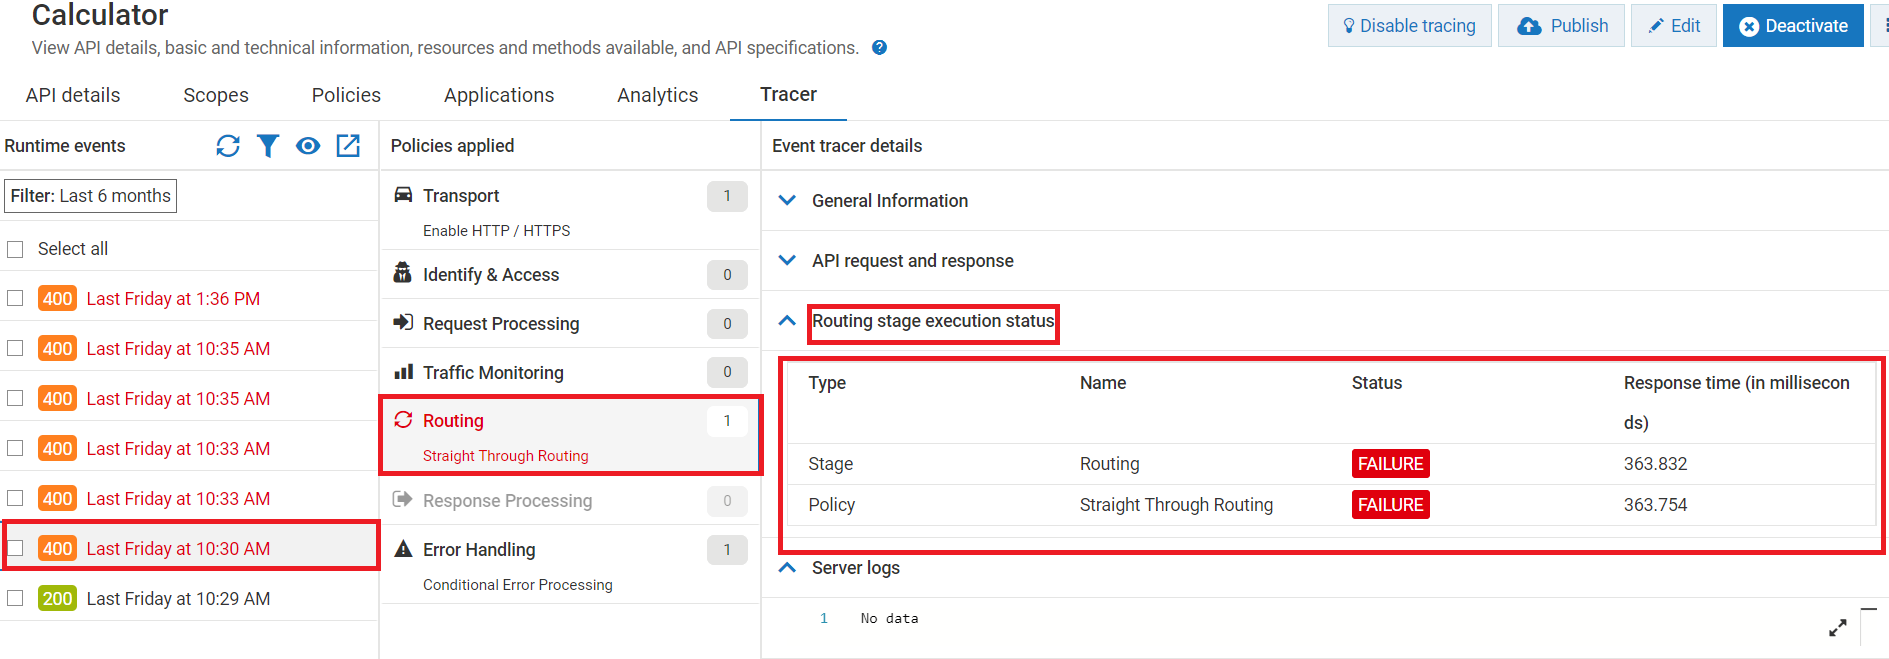
2. In the Policies applied section, click the stage name highlighted in red for which you want to inspect the trace details.
The Trace API page refreshes the Event tracer details section with the stage_ name stage execution status section displaying the status and response time of the stage and policies that failed during API invocation.
Note:
In the Policies applied section, if no policies in a stage is enforced during the invocation then that stage is disabled. In this use case, Response Processing stage is disabled and it is not enforced as the API invocation fails in the Routing stage. The Error Handling stage was enforced in order to handle the Routing stage failure.
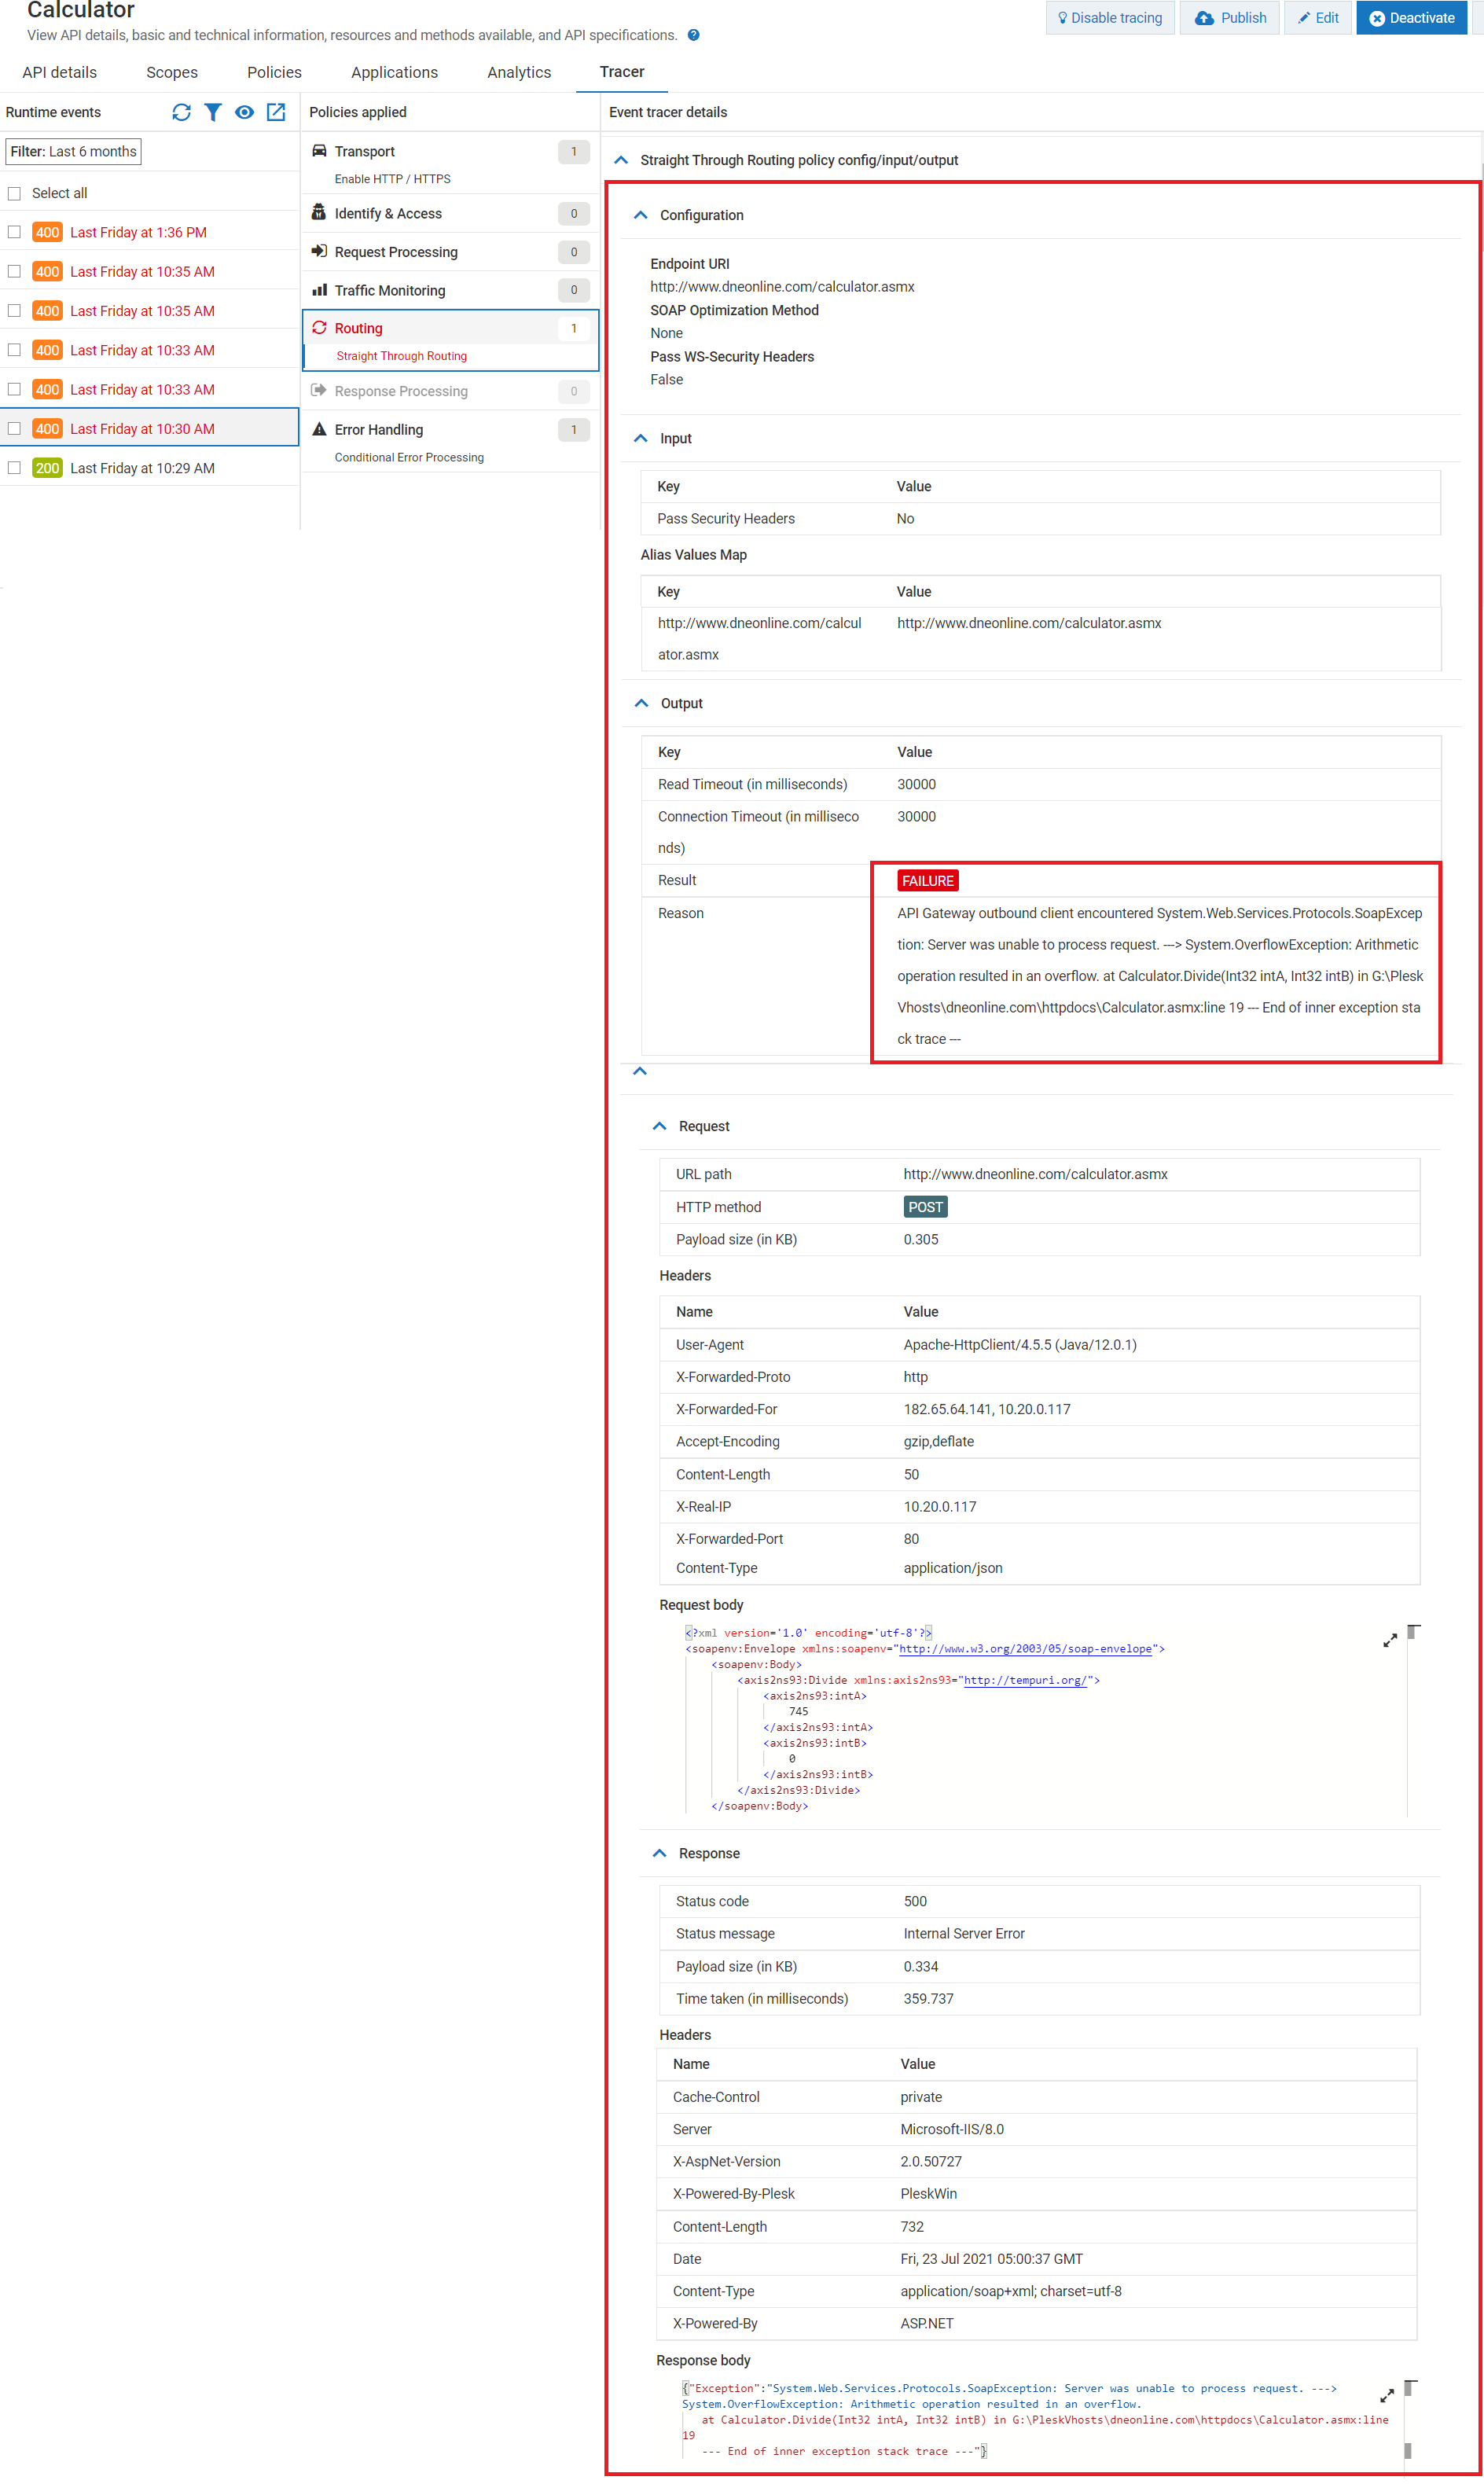
3. In the Policies applied section, click the policy name request highlighted in red for which you want to inspect the trace details.
The Trace API page refreshes the Event tracer details sections with the policy_name policy config/input/output section displaying the configuration details, values that are passed during the enforcement of that policy, transformation conditions, and payloads. It also highlights the exact location where the policy invocation failed along with the failure reason.
Note:
The template of the policy_name policy config/input/output section varies based on the policy