Cluster-level Monitoring
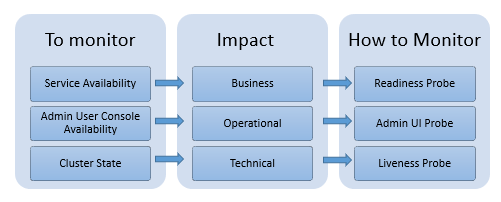
The cluster-level monitoring ensures service availability, which refers to the overall system, that is the availability of access and functionality of API Gateway. It checks whether API Gateway is ready to serve requests. Through cluster-level monitoring, you can check:

If all the nodes in the cluster are available and ready to serve the traffic.
If the administrator console is accessible.
How do I monitor the cluster health of API Gateway?
You can set up the Readiness Probe, Liveness Probe, and Admin UI Probe to monitor the cluster health.
How do the probes help in cluster-level monitoring?
| Readiness Probe | Liveness Probe | Admin UI Probe |
What is it? | Indicates if the traffic-serving port of API Gateway is ready to accept requests. | Reports on the overall cluster health and indicates if the components of API Gateway are in an operational state. | Indicates if the API Gateway administrator console is available and accessible. |
When is it used? | To continuously check and report on the service availability of API Gateway. | To continuously report on the cluster health with the details of the components involved in clustering. | To continuously report on the availability of the administrator console and API analytics. |
Note:
The points in the table are also applicable to scenarios where the cluster health is NOT OK, for example, API Data Store or Terracotta failure. Such scenarios do not always mean an outage. API Gateway may still be able to process the requests.
How do I set up probes?
Prerequisites:
You must be a valid
API Gateway user for using the Liveness probe and Admin UI probe.
All the cluster-level probes must be setup to target
API Gateway load balancer endpoint.
Software AG recommends to set up a dedicated port for monitoring with an appropriate private thread pool.
Set up Readiness Probe at Cluster-Level
To monitor the readiness of API Gateway, that is to check if API Gateway is ready to serve the requests, use the following REST endpoint:
GET /rest/apigateway/health
The following table shows the response code and the status.
Response | Status |
200 OK | Readiness check is successful. Readiness probe continues to reply OK if API Gateway remains in an operational state to serve the requests. |
500 Internal server error | Readiness check failed and denotes a problem. |
timeout or no response as the request did not reach the probe | Several factors can contribute to the delay when the Readiness Probe initiates, which may result in the timeout errors. To know the reasons for timeout errors, see
Causes for timeout errors for more information. |
Note:
By design, response JSON is not returned when there is a problem.
Set up Liveness Probe at Cluster-Level
To monitor the liveness of API Gateway, that is to check the cluster health of API Gateway, use the following REST endpoint:
GET /rest/apigateway/health/engine
The following table shows the response code and the status.
Response | Status |
200 OK | Liveness check is successful. |
500 Internal server error | Liveness check failed and denotes a problem. The response JSON indicates the problem. |
timeout or no response as the request did not reach the probe | Several factors can contribute to the delay when the Liveness Probe initiates, which may result in the timeout errors. To know the reasons for timeout errors, see
Causes for timeout errors for more information. |
The response JSON of each health check request displays a status field as the first entry in the response. The status can have the values green, yellow or red describing the overall status of the components to check.
The overall status of API Gateway can be green or red.
Green indicates that the cluster is in a healthy state.
Red indicates the cluster failure and an outage.
The overall status of API Gateway is assessed based on the API Data Store status as follows:
When the internal status of API Data Store signals
green or
yellow, the overall status is
green.
yellow indicates node failure. However, the cluster is still functioning and operational.
When the internal status of API Data Store signals
red, the overall status is red.
When API Data Store port is inaccessible, the overall status is
red.
The overall status is assessed based on the Integration Server status as follows:
When one of the resource types memory, diskspace, and service thread reveals a resource problem, then the overall engine status is set to
yellow.
The status of Terracotta is displayed as follows:
Green indicates that
Terracotta is in a healthy state.
Red indicates poor health and an outage.
A sample HTTP response is as follows:
{
"status": "green",
"elasticsearch": {
"cluster_name": "SAG_EventDataStore",
"status": "yellow",
"number_of_nodes": "1",
"number_of_data_nodes": "1",
"timed_out": "false",
"active_shards": "95",
"initializing_shards": "0",
"unassigned_shards": "92",
"task_max_waiting_in_queue_millis": "0",
"port_9240": "ok",
"response_time_ms": "526"
},
"is": {
"status": "green",
"diskspace": {
"status": "up",
"free": "908510568448",
"inuse": "104799719424",
"threshold": "101331028787",
"total": "1013310287872"
},
"memory": {
"status": "up",
"freemem": "425073672",
"maxmem": "954728448",
"threshold": "92222259",
"totalmem": "922222592"
},
"servicethread": {
"status": "up",
"avail": "72",
"inuse": "3",
"max": "75",
"threshold": "7"
},
"response_time_ms": "258"
},
"terracotta": {
"status": "green",
"nodes": "1",
"healthy_nodes": "1",
"response_time_ms": "22"
}
}
The overall cluster status is green since all components work as expected.
Set up Admin UI Probe at Cluster Level
To check the availability and health status of the API Gateway administration service (UI, Dashboards) at the cluster level, use the following REST endpoint:
GET /rest/apigateway/health/admin
The following table shows the response code and the status.
Response | Status |
200 OK | Everything is good |
500 Internal server error | Denotes a problem. The response JSON indicates the problem. |
timeout or no response as the request did not reach the probe | Several factors can contribute to the delay when you initiate the Admin UI Probe, which may result in the timeout errors. To know the reasons for timeout errors, see
Causes for timeout errors for more information. |
The overall Admin UI Probe status can be green or red based on the API Gateway administration service's health and Kibana status.
The overall Admin UI Probe status is assessed based on the Kibana status as follows:
When Kibana's port is accessible, the overall status is
green.
When Kibana's port is inaccessible, the overall status is
red.
When Kibana's communication with API Data Store is not established, the overall status is
red.
A sample HTTP response is as follows:
{
"status": "green",
"ui": {
"status": "green",
"response_time_ms": "40"
},
"kibana": {
"status": {
"overall": {
"state": "green",
"nickname": "Looking good",
"icon": "success",
"uiColor": "secondary"
}
},
"response_time_ms": "36"
}
}
The overall status is green since API Gateway administration service and Kibana is in a healthy state.