How do I view the trace details?
This use case starts when you want to view the stage-wise and policy-wise trace details about the selected client request and ends when you view the trace details at the policy level.
Before you begin
Ensure that you have:
 Manage APIs
 and
Activate APIs privileges.
Invoked the API after you have enabled the tracer.

To view the trace details
1. In the Runtime events section, click the client request for which you want to view the trace details.
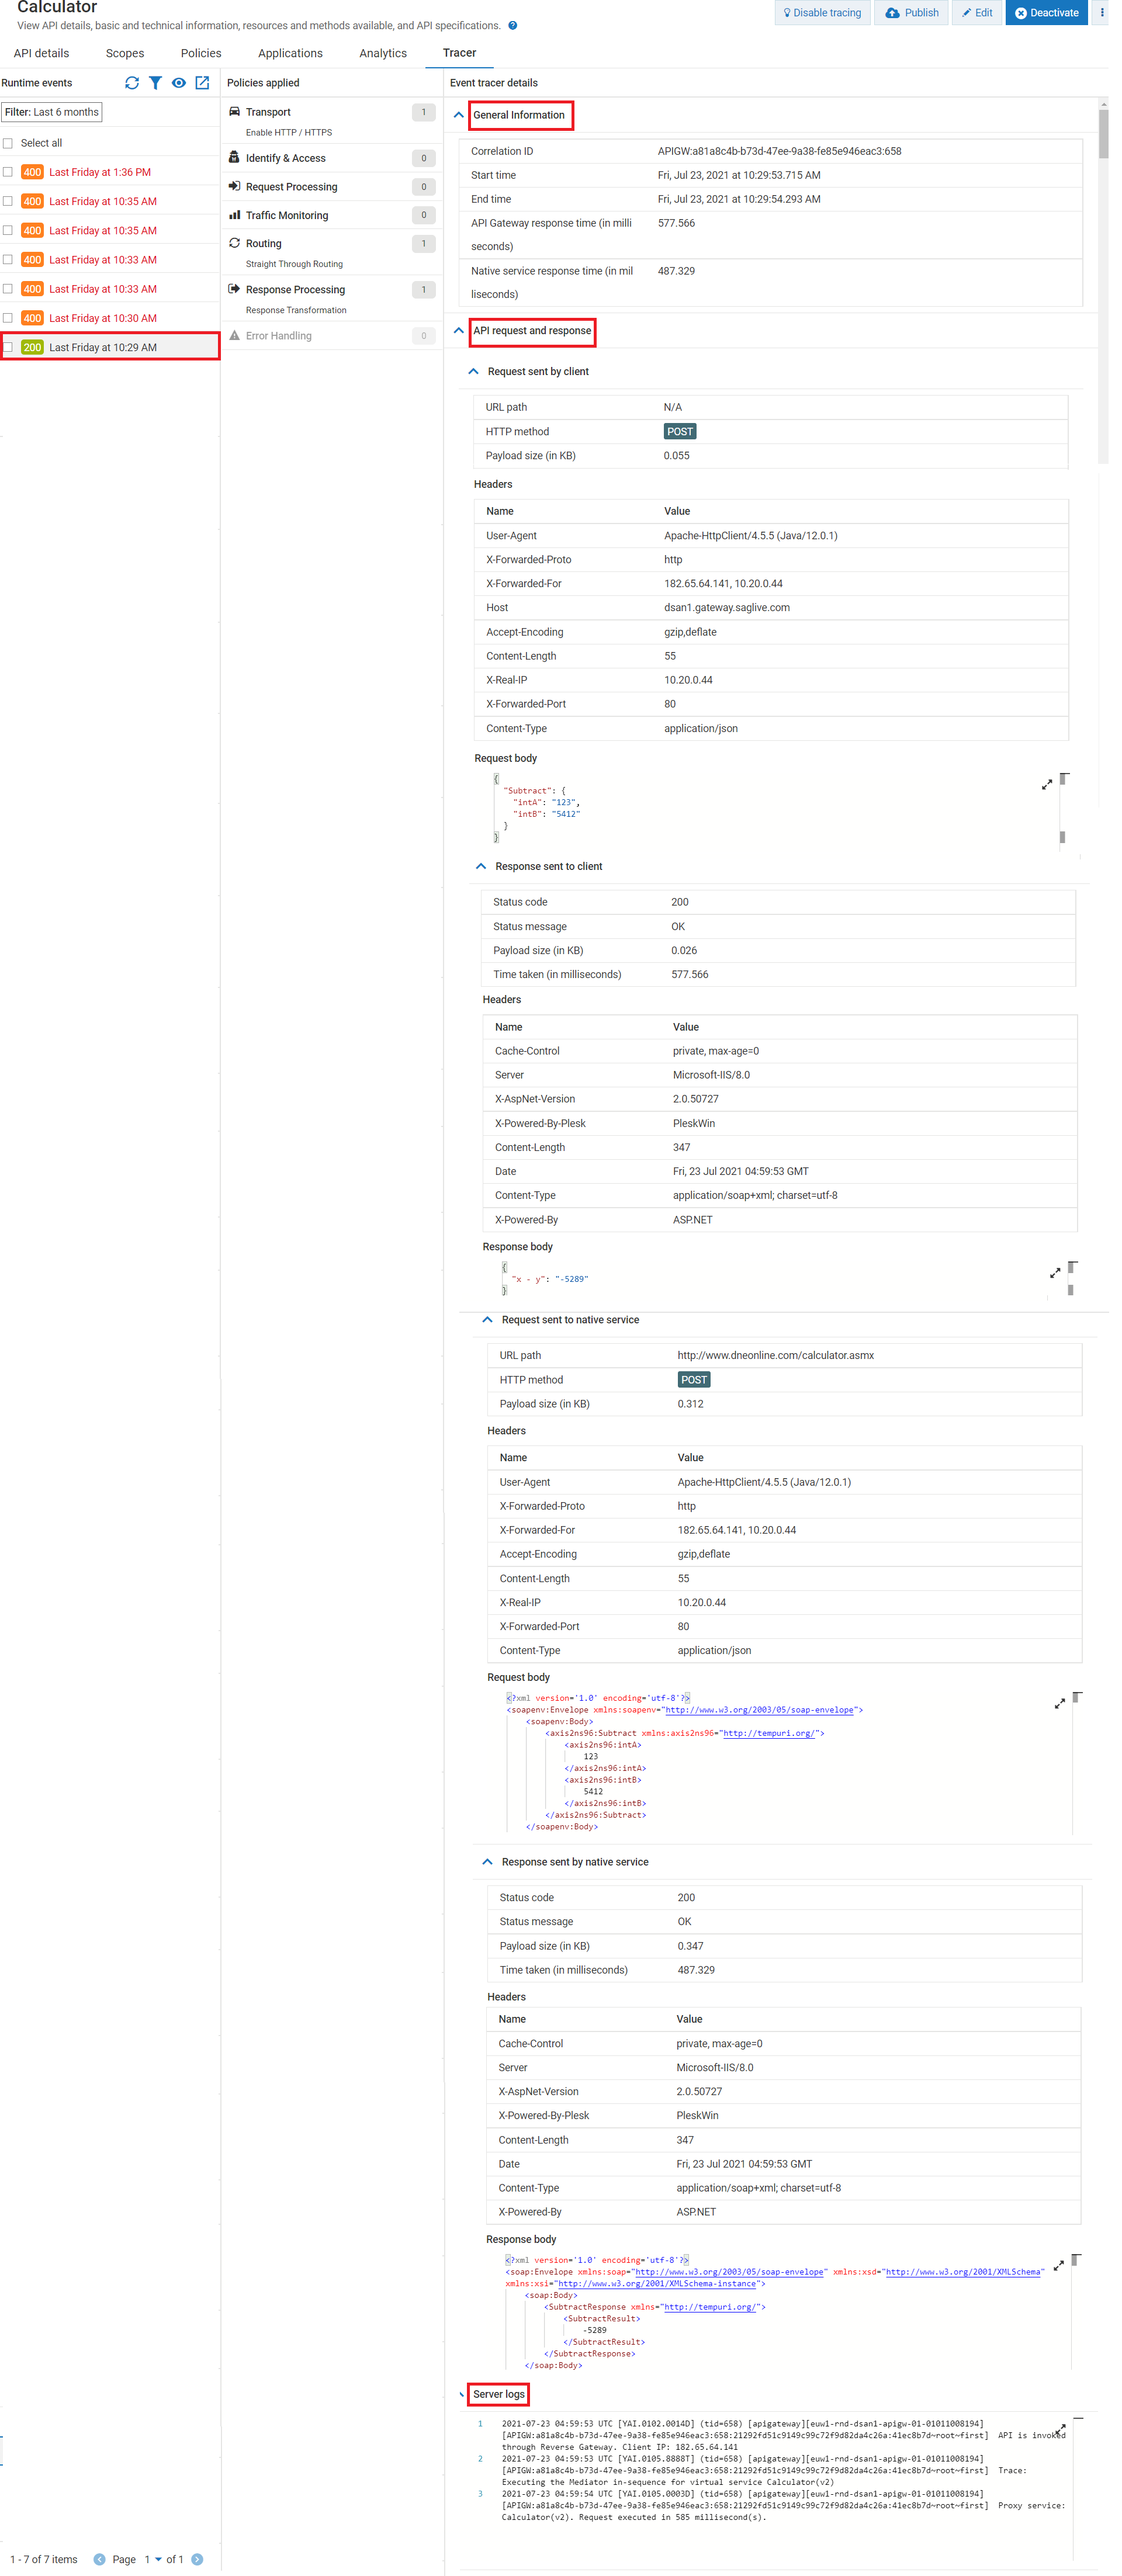
The Trace API page refreshes and populates data in the Policies applied and Event tracer details sections. By default, the Event tracer details section displays the General Information, API request and response, and Server logs sections. Under the API request and response section, you have the following sub-sections:
Request sent by client. Displays the request headers and request body sent by the client to API Gateway.
Response sent to client. Displays the response headers and response body sent to the client from API Gateway.
Request sent to native service . Displays the request headers and request body sent to the native API from API Gateway.
Response sent by native service. Displays the response headers and response body sent by the native API to API Gateway.
Note:
If the request and response body has streaming content, the tracer does not capture the streaming content even if you have enabled the tracer.
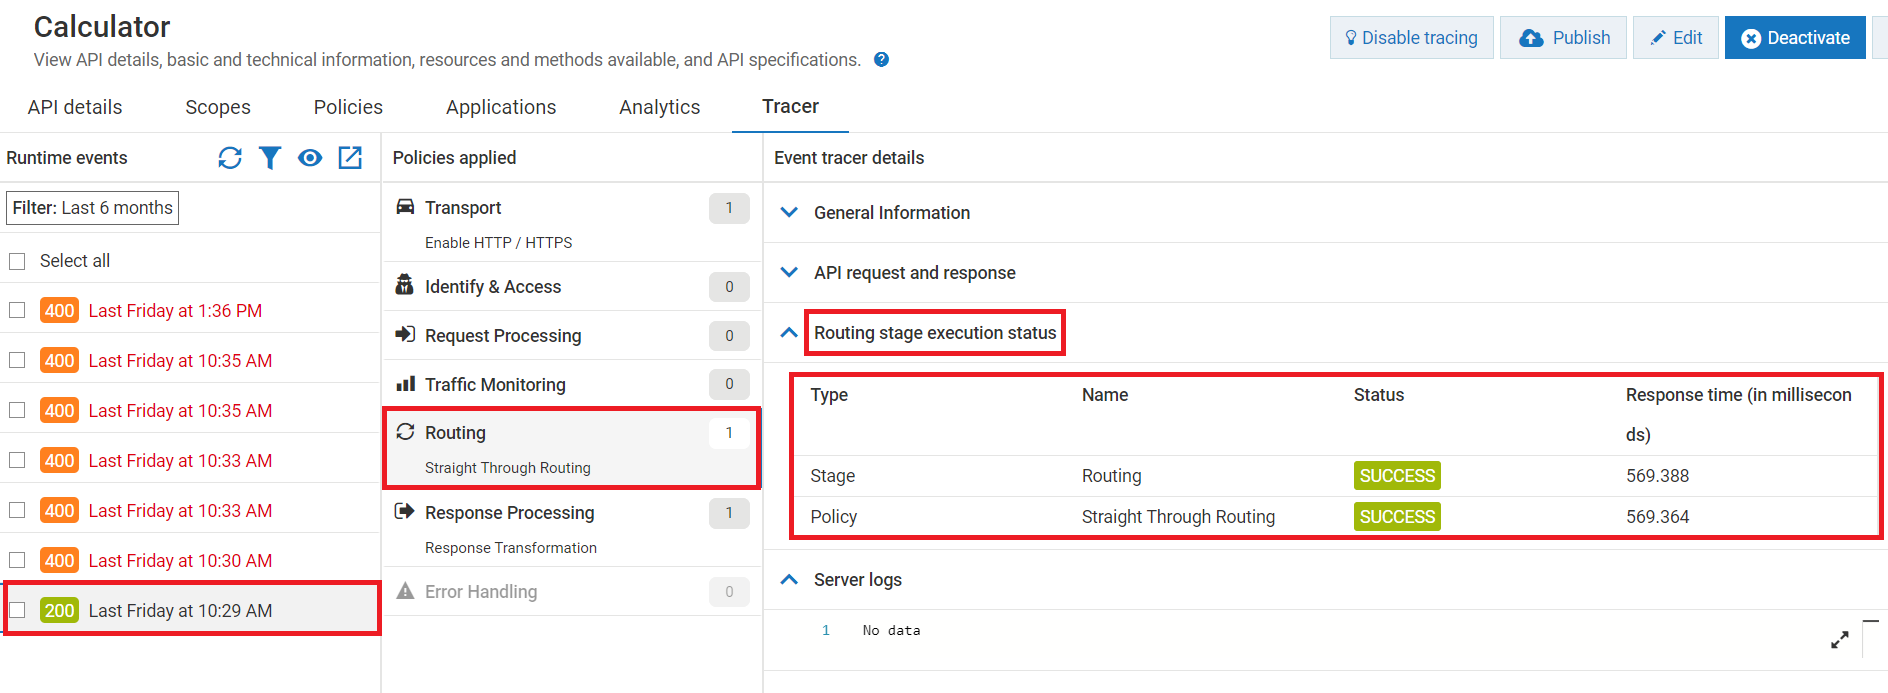
2. In the Policies applied section, click the stage name for which you want to view the trace details
The Trace API page refreshes the Event tracer details section with the stage_ name stage execution status section displaying the status and response time of the stage and policies that are enforced during API invocation.
Note:
In the
Policies applied section, if no policies is enforced in a stage during the invocation then that stage is disabled. In this use case,
Error Handling stage is disabled.
The
Status column indicates that whether the corresponding policy is invoked or not. If the
Status column displays

, it indicates the corresponding policy is enforced successfully during invocation but it does not mean that the conditions specified in the policy are matched. You can click the respective policy to know more details on how the conditions were applied during invocation.
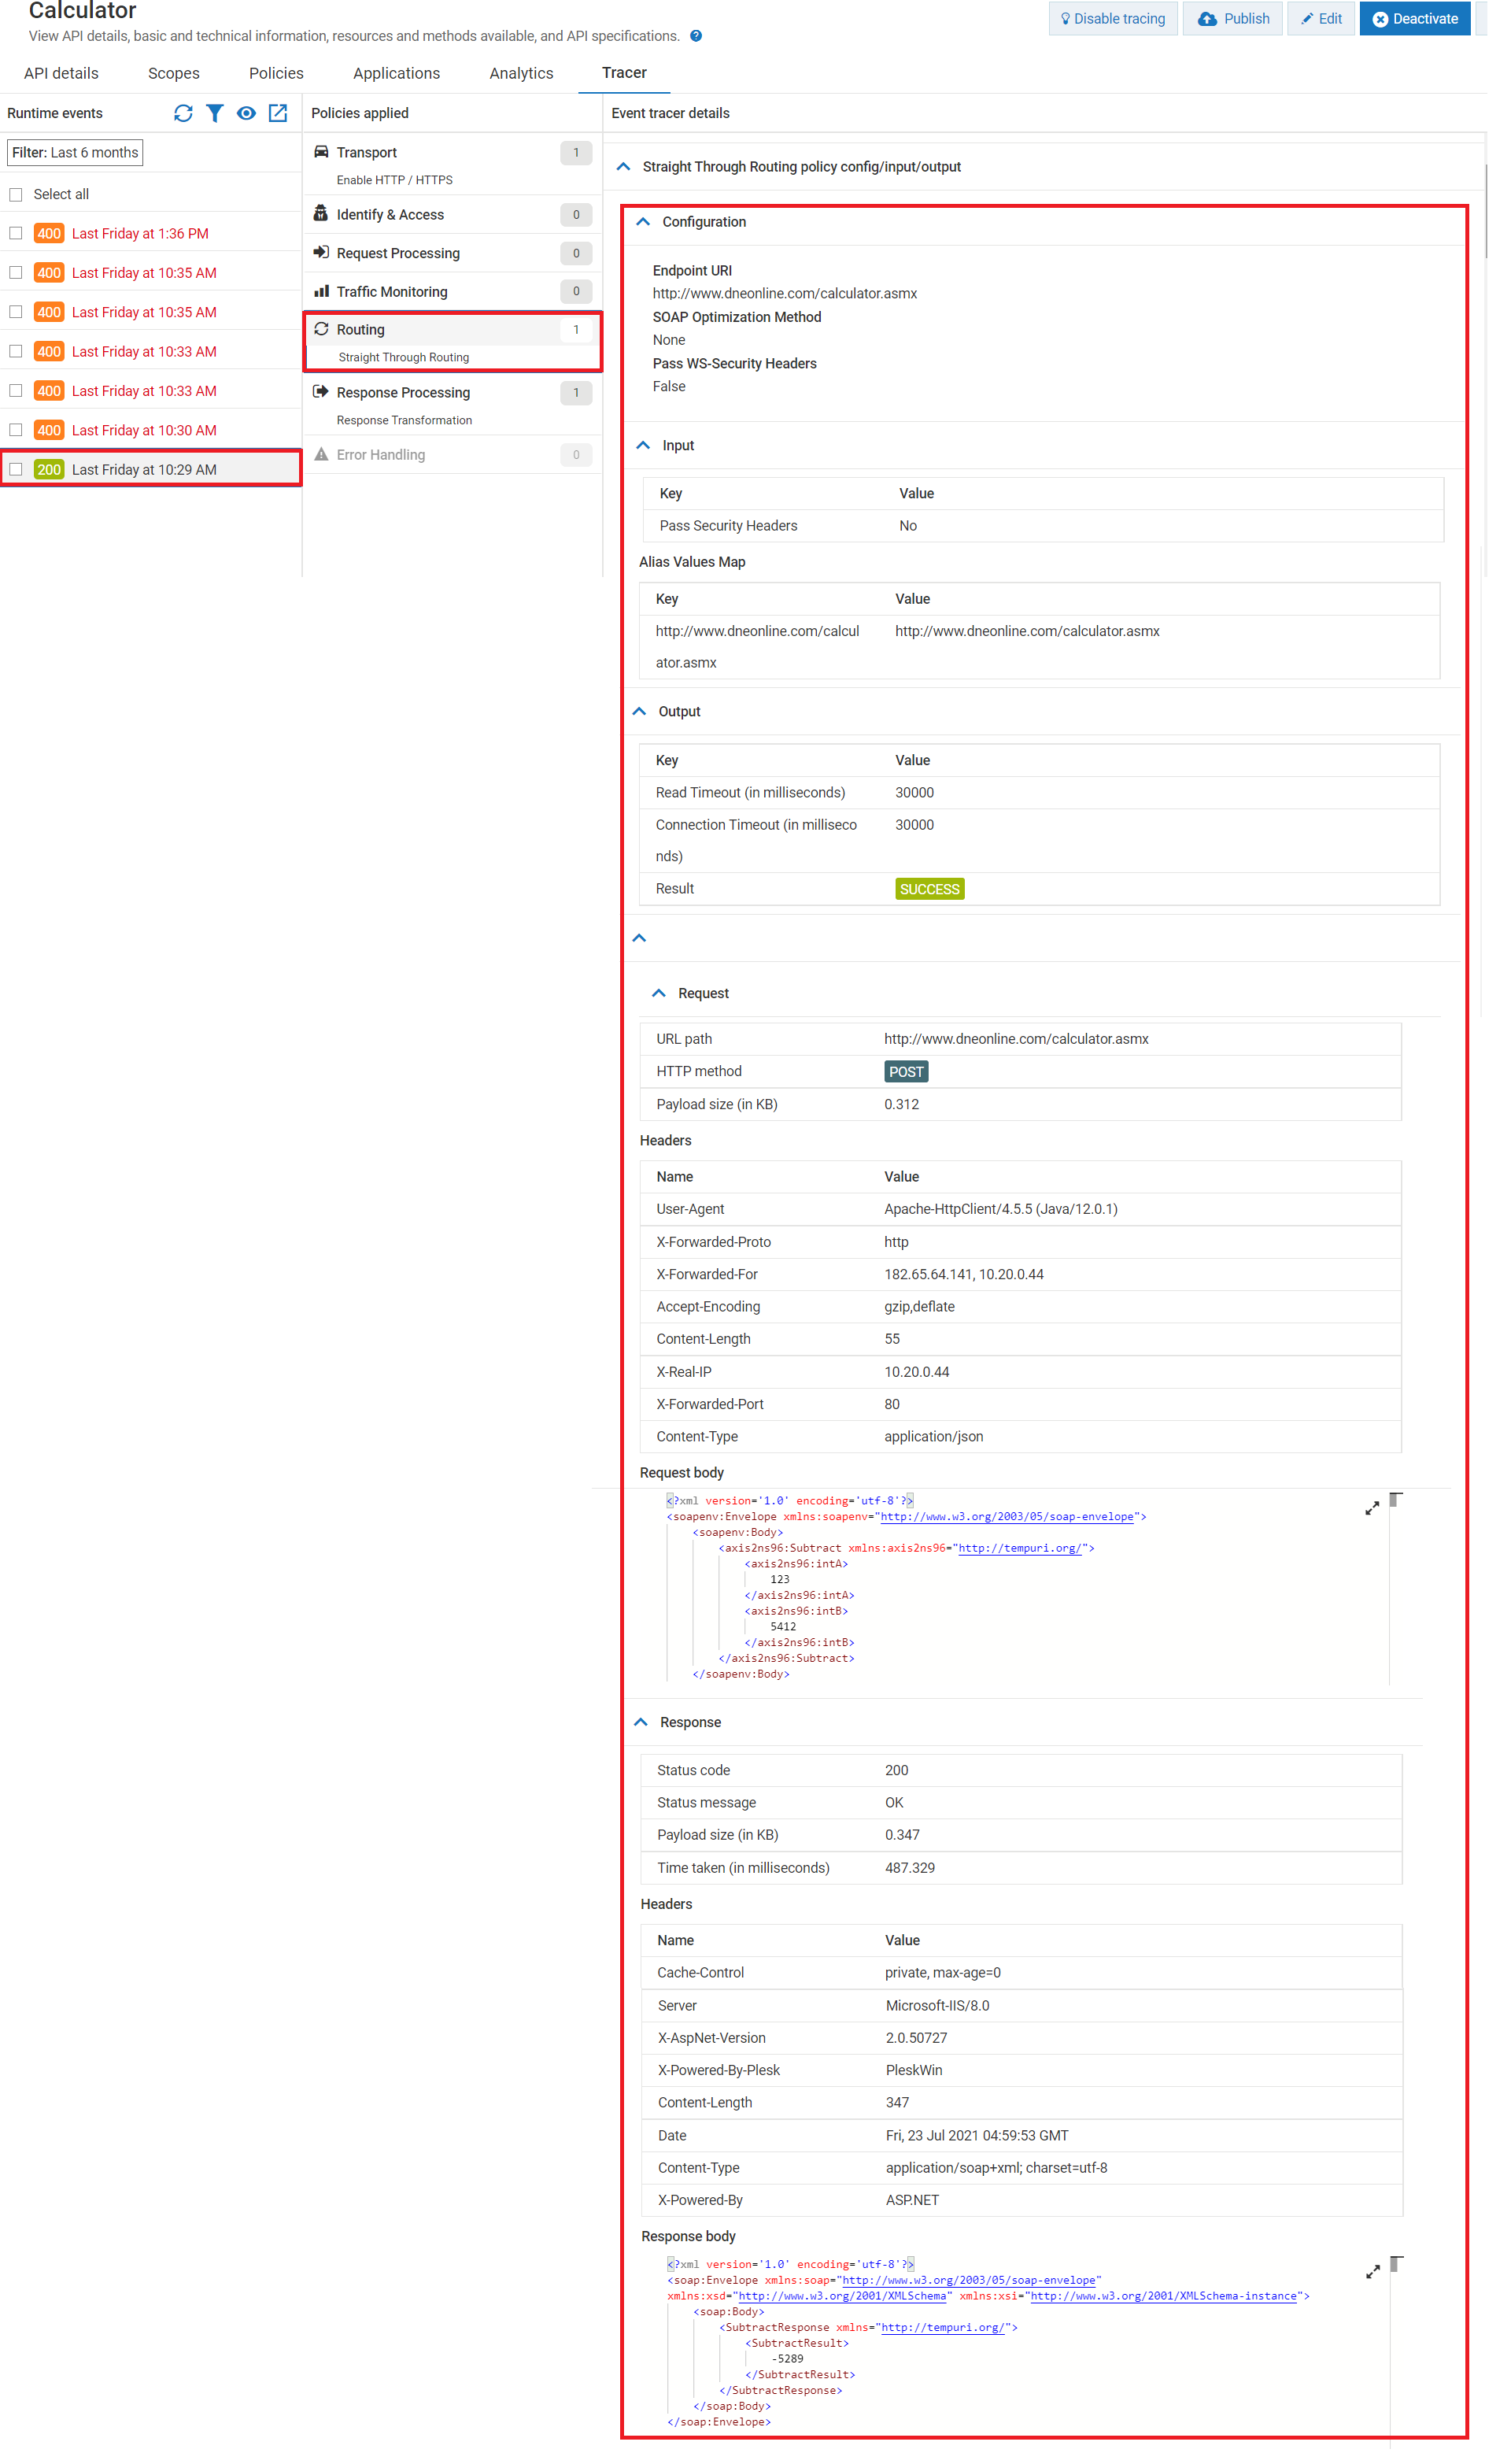
3. In the Policies applied section, click the policy name for which you want to view the trace details
The Trace API page refreshes the Event tracer details sections with the policy_name policy config/input/output section displaying the configuration details, values that were passed as input before the enforcement of the policies and values that were transformed at the end of the policy enforcement, conditions and transformations that were applied and performed at the time of invocation, and payloads.
Note:
The template of the policy_name policy config/input/output section varies based on the policy