How Do I Monitor the Health Status of the Data Center?
This use case explains how to track and monitor the health status of the data centers in the consistent hash ring using the REST API GET /rest/apigateway/dataspace/status. The status can be GREEN, YELLOW, or RED.
If the health status is GREEN, then all the data centers are able to communicate with one another without any problem.
If the health status is YELLOW, then it indicates that this data center is unable to communicate with one or more of the data centers in the ring. This might be because one or more data centers in the ring is down temporarily as it is getting restarted. It could also be permanently down because of connection issue or the API Gateway instance is down. The API Gateway waits for a certain period of time (as configured in the pg_Dataspace_TimeToFail) before marking the data center as down. Once the data center is marked as down, it will be marked as failed data center and health status will be marked as YELLOW. The node gets marked as YELLOW until the time configured in the pg_Dataspace_WarmupTime property gets elapsed. If the data center is not up even after the time specified in the pg_Dataspace_WarmupTime property, then the health status is marked as RED.
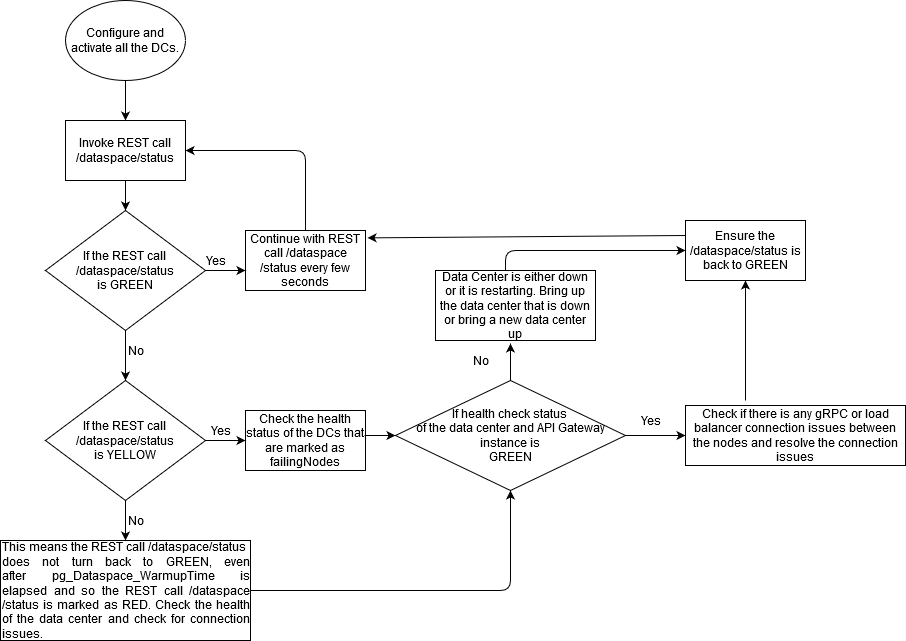
The following flow chart explains how the health of the data center is monitored using the GET /rest/apigateway/dataspace/status REST API:
For example, assume that you have three data centers DC 1, DC 2, and DC 3 in the following landscape:
Data Center Name | Host Name | Region |
DC 1 | uk.myhost.com | United Kingdom |
DC 2 | us.myhost.com | United States |
DC 3 | in.myhost.com | India |
In general, the active-active mode can accommodate any number of data centers in the consistent hash ring. But in the hot standby mode there are only two nodes in the ring.

To track the health status of the data centers
1. Invoke the REST API to track the health status.
Track the health status of the data center in the consistent hash ring using the REST API GET /rest/apigateway/dataspace/status
Note:
To invoke the REST API, you must provide the basic authentication.
For example:
Request: GET http://uk.myhost.com:5555/rest/apigateway/dataspace/status.
HTTP response appears as follows:
{
"detectedNodes": [
{
"nodeName": "a04609a0-ca13-44db-98e1-f988ba18fbb4",
"host": "us.myhost.com",
"port": 4440
},
{
"nodeName": "4820681b-f2fd-42d7-bccd-cf580ea8bf1c"
"host": "in.myhost.com",
"port": 4440
}
],
"liveNodes": "[a04609a0-ca13-44db-98e1-f988ba18fbb4],[4820681b-f2fd-42d7-bccd-cf580ea8bf1c]"
"health": "GREEN"
}
When all the data center is able to communicate, the response status code displays as 200 and health status displays as GREEN.
2. Invoke the REST API to detect the failing nodes .
Detect the failing nodes in the consistent hash ring when the health status is in YELLOW using the REST API GET /rest/apigateway/dataspace/status?watchFailingNodes=true. For example:
Request: GET http://uk.myhost.com:5555/rest/apigateway/dataspace/status?watchFailingNodes=true.
HTTP response appears as follows:
{
"detectedNodes": [
{
"nodeName": "a04609a0-ca13-44db-98e1-f988ba18fbb4",
"host": "us.myhost.com",
"port": 4440
},
{
"nodeName": "4820681b-f2fd-42d7-bccd-cf580ea8bf1c"
"host": "in.myhost.com",
"port": 4440
}
],
"liveNodes": "[a04609a0-ca13-44db-98e1-f988ba18fbb4],[4820681b-f2fd-42d7-bccd-cf580ea8bf1c]"
"failingNodes":"[4820681b-f2fd-42d7-bccd-cf580ea8bf1c]"
"health": "YELLOW"
}
Though the DC 3 is detected as failing node, the response status code displays as 200 and health status displays as YELLOW.
Note:
If the DC 3 does not come back even after the time specified in the pg_Dataspace_TimeToFail and pg_Dataspace_WarmupTime properties, then the health status is marked as RED. In that case, the number of detected nodes and lives nodes differs in the response payload.
HTTP response appears as follows:
{
"detectedNodes": [
{
"nodeName": "a04609a0-ca13-44db-98e1-f988ba18fbb4",
"host": "us.myhost.com",
"port": 4440
},
{
"nodeName": "4820681b-f2fd-42d7-bccd-cf580ea8bf1c"
"host": "in.myhost.com",
"port": 4440
}
],
"liveNodes": "[a04609a0-ca13-44db-98e1-f988ba18fbb4]"
"failingNodes":"[4820681b-f2fd-42d7-bccd-cf580ea8bf1c]"
"health": "RED"
}
The response status code displays as 500 and health status displays as RED.
3. Invoke the REST API to monitor the gossip data.
Monitor the gossip vector element value in the nodes, when the health status is in YELLOW using the REST API GET /rest/apigateway/dataspace/status?watchFailingNodes=true &fetchGossipData=true to ensure if the Gossiping protocol works well. For example:
Request: GET http://uk.myhost.com:5555/rest/apigateway/dataspace/status?watchFailingNodes=true &fetchGossipData=true.
HTTP response appears as follows:
{
"detectedNodes": [
{
"nodeName": "a04609a0-ca13-44db-98e1-f988ba18fbb4",
"host": "us.myhost.com",
"port": 4440
},
{
"nodeName": "4820681b-f2fd-42d7-bccd-cf580ea8bf1c"
"host": "in.myhost.com",
"port": 4440
}
],
"liveNodes": "[a04609a0-ca13-44db-98e1-f988ba18fbb4],[4820681b-f2fd-42d7-bccd-cf580ea8bf1c]"
"failingNodes":"[4820681b-f2fd-42d7-bccd-cf580ea8bf1c]"
"gossipData": "[a04609a0-ca13-44db-98e1-f988ba18fbb4, 121],[4820681b-f2fd-42d7-bccd-cf580ea8bf1c, 78]"
"health": "YELLOW"
}
The DC 3 is detected as failing node and the gossip vector element in the DC 3 does not get incremented, the response status code displays as 200 and health status displays as YELLOW. API Gateway waits until the time specified in the pg_Dataspace_TimeToFail property, once the time elapses, then DC 3 is removed from the ring and marked as down.