How do I filter the runtime request?
This use case starts when you want to filter the client request based on its runtime events and ends when you view the trace details of the filtered client request.

To filter the runtime event
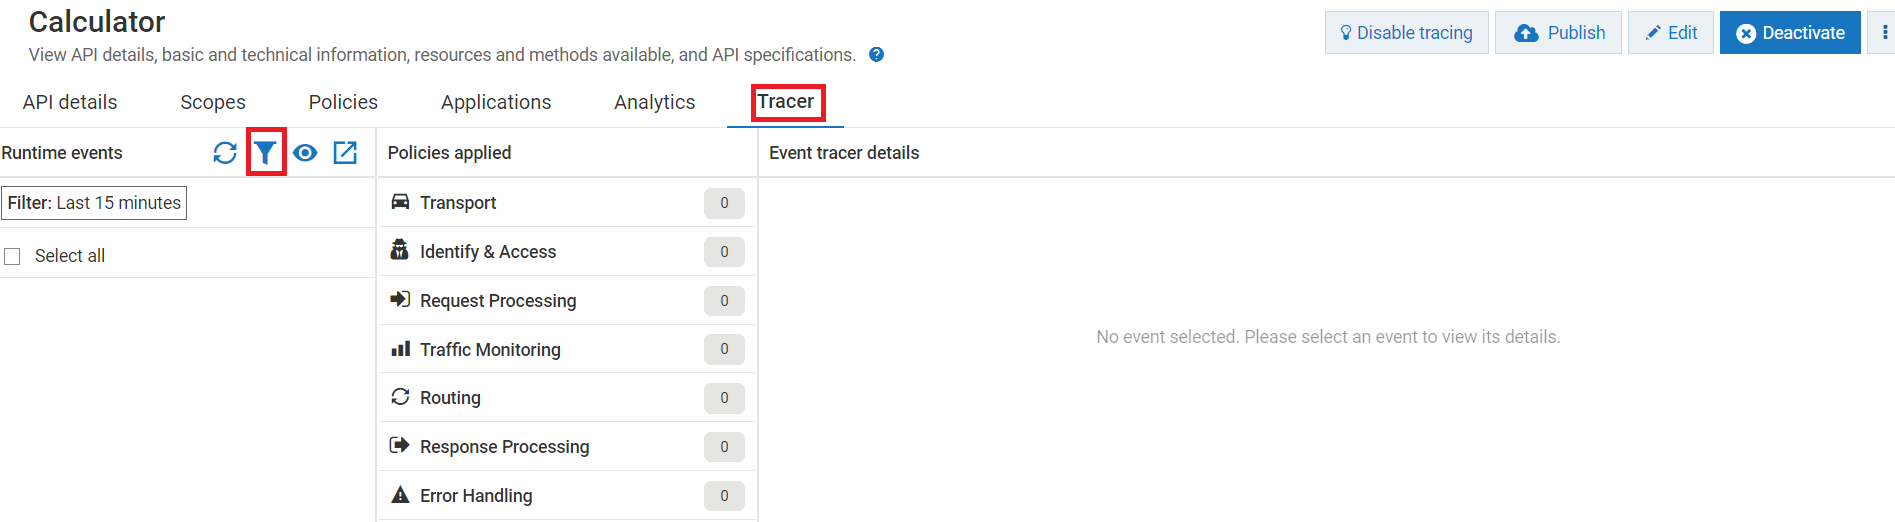
1. Click the Tracer tab.
The Trace API page displays the Runtime events, Policies applied, and Event tracer details sections.
2. In the Runtime events section, click  to filter the runtime events.
 The Apply filter pop-up window displays.
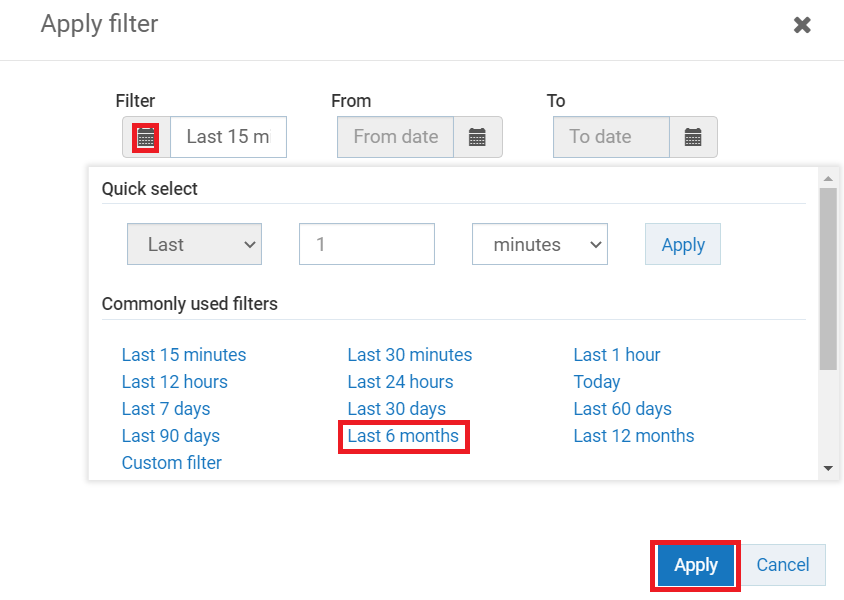
3. To filter the runtime events, click  and select the time interval using the options:
  Quick select
. Specify the time interval. Click
Apply to filter the runtime events based on the time interval.
Commonly used. Select a commonly used time interval, and the filter is applied automatically. To view the runtime events between a time interval, click
Custom range >
From Date >
To Date >
Apply.
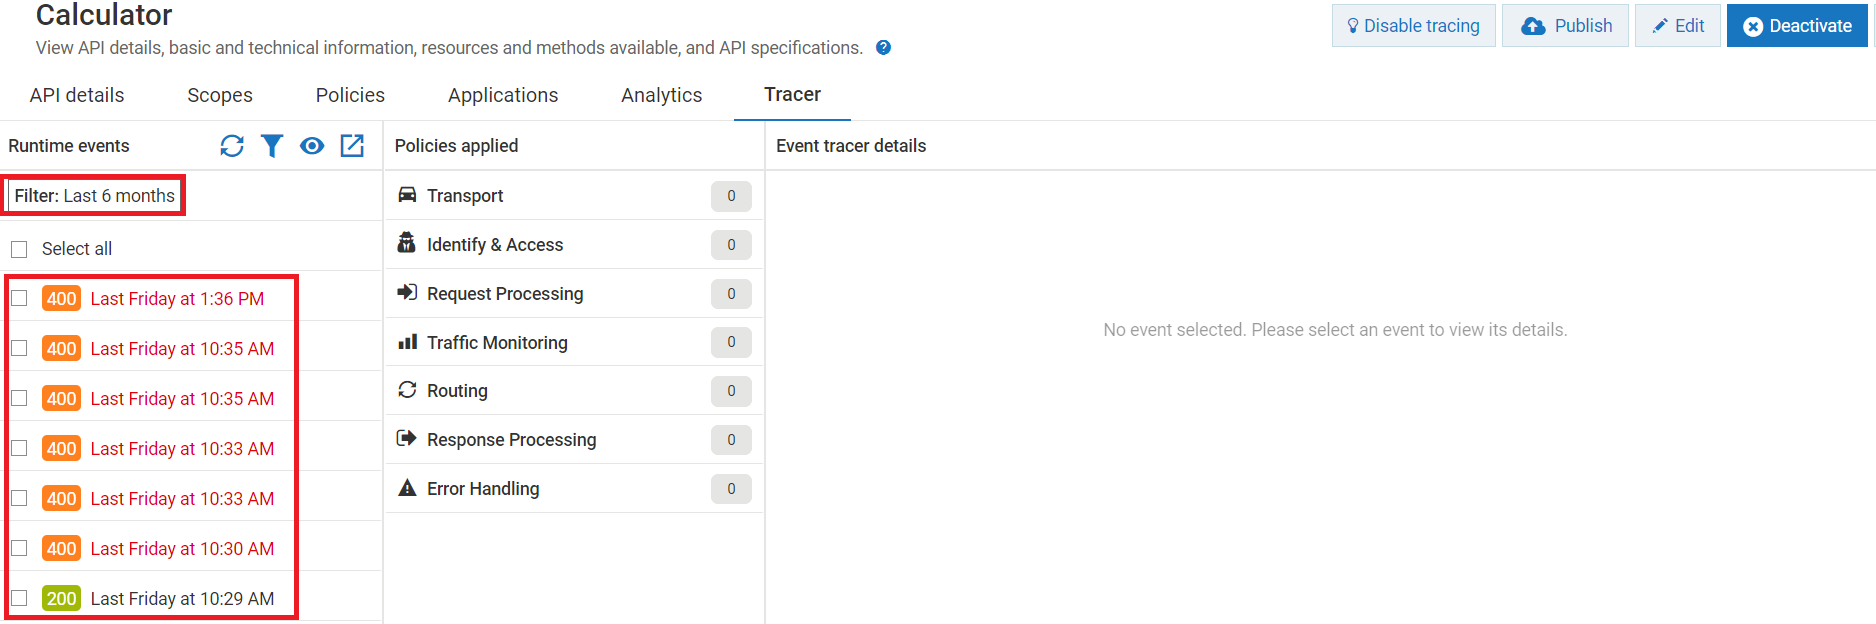
The Runtime events section displays the list of runtime events based on the applied filter.
The runtime events are displayed using various legends to indicate the different types of requests along with their status code.
The below table displays the legends and their description:
Legends | Description |
| Successful API calls |
| Failed API calls due to client-side errors |
| Failed API calls due to Server-side errors |
| Redirection calls |
| Informational calls |