Monitoring API Data Store
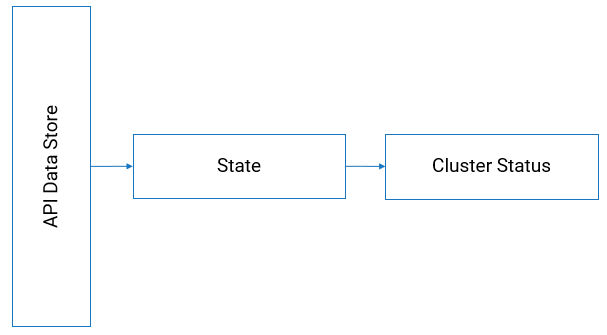
As part of application monitoring, you can monitor the state, that is the cluster status of API Data Store along with the resources.
How do I monitor the health of API Data Store?
Prerequisites:

You must have a valid
API Gateway user credential for using the Readiness Probe and Liveness Probe.
All the node level probes must be setup to target the local instance, typically, localhost.
Software AG recommends to set up a dedicated port for monitoring with an appropriate private thread pool.
Readiness Probe at Node-Level
To monitor the readiness of API Data Store, that is to check if API Data Store has started successfully, use the following REST endpoint:
GET HTTP://host:port/_cluster/health
The following table shows the response code and the description.
Response | Description |
200 OK | Readiness check is successful. |
500 Internal server error | Readiness check failed and denotes a problem. The response JSON indicates the problem. If readiness probe fails, you can perform one of the following actions: If you have installed API Gateway directly, check the API Data Store logs to find the status or exception. If you have installed API Gateway through docker image or Kubernetes, ensure that the existing pod is resolved or a new pod is created (automatically) and ready for serving the requests. |
timeout or no response as the request did not reach the probe | Several factors can contribute to the delay when the Readiness Probe initiates, which may result in the timeout errors. To know the reasons for timeout errors, see
Causes for timeout errors for more information. |
Liveness Probe at Node-Level
As API Data Store works in a cluster-based environment, the result of the Liveness Probe is determined by the cluster health. You can check the cluster status using the same endpoint mentioned for the Readiness Probe.
How do I collect metrics?
Metrics collection is reported in the Prometheus data format. Prometheus is a non-
Software AG dashboarding tool that helps in trend analysis. For more information, see
https://prometheus.io/. The Prometheus metrics names can differ in your environment if you are using a different Prometheus exporter like ES exporter.