The Intervals for Metric Publishing
CloudStreams tracks performance metrics by intervals. The interval is a period of time you set in CloudStreams, during which metrics are collected for reporting to CloudStreams.
There are two cases in which you specify an interval when measuring performance:

When you publish performance indicator (KPI) metrics and events to the
CloudStreams Analytics dashboard. In this case, you set the interval in
Integration Server Administrator, in
Solutions > CloudStreams > Administration > Database.

When monitoring a virtual service's run-time performance with the actions
Monitor Service Performance,
Monitor Service Level Agreement, or
Throttling Traffic Optimization. In this case, you set an interval in the action's
interval parameter.
The rules of intervals are the same in both cases.
CloudStreams only tracks metrics for the current interval. At the end of the interval, CloudStreams aggregates the metrics and reports them to CloudStreams. CloudStreams resets its counters immediately for the next interval, even if the last interval's data has not yet been reported to the database (so there is no gap between intervals when metrics are not accumulated). CloudStreams does not calculate and aggregate metrics across intervals. If CloudStreams is shut down or the service is undeployed before the current interval expires, the performance data is discarded.
Examples of interval metric publishing
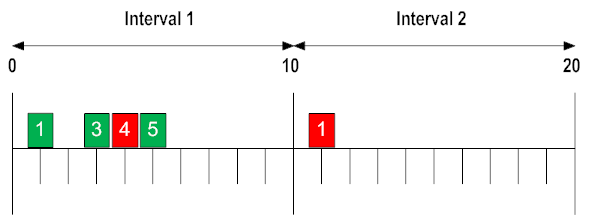
For example, suppose that the tracking interval is 10 minutes. One of the key performance indicator (KPI) metrics is Availability, which reports the amount of time that a service was available during the current interval, shown as a percentage. The green boxes in the illustration below indicate successful requests and the red ones indicate unsuccessful requests.
A request is considered unsuccessful when a network fault occurs or when the native service is unavailable due to the following errors:

ConnectException

MalformedURLException

NoRouteToHostException

ProtocolException

SocketTimeoutException

UnknownHostException

UnknownServiceException

Web Service not available

The service cannot be found
In the case of a normal application-level SOAP fault, CloudStreams considers the request to be successful. In the illustration below, in Interval 1 (0 - 10 minutes) a request failed at the 4 minute mark, followed by a successful request at the 5 minute mark. Therefore, CloudStreams considers the interval between 4 and 5 minutes to be service downtime (even though this may not be accurate). So in this case, for Interval 1 the availability is 9/10 (90%). In the case of Interval 2, only one request was sent, and it failed at the 1 minute mark. Therefore, CloudStreams considers the time between 1 minute to the end of the interval as service downtime. So the time between the start of Interval 2 (the 10 minute mark) to the failed request is service uptime (1 minute); the availability is 1/10 (10%) for Interval 2. At the end of the interval, CloudStreams resets the KPI metrics.
The Availability status of a service is transferred to the beginning of the next interval. When CloudStreams starts up, it is assumed that the services are available. If a service is unavailable at the end of interval 1, and no activity occurs for several intervals, the service's availability is 0 during the intervals when no activity occurred.
