CentraSite 10.7 | CentraSite User’s Guide | Asset Management | Asset Navigator | Asset Navigator in CentraSite Business UI | Types of Charts | Icicle Chart
 
Icicle Chart
Icicle chart is a hierarchical representation of the assets in a horizontal graph format. Icicle charts are also known as Call Tree. The calls start from the first call in the hierarchy descending to the one that directly created the object set. Each call is a horizontal bar whose length depends on the size of objects allocated in the call's subtree. The more data allocated in the underlying subtree, the longer the bar.
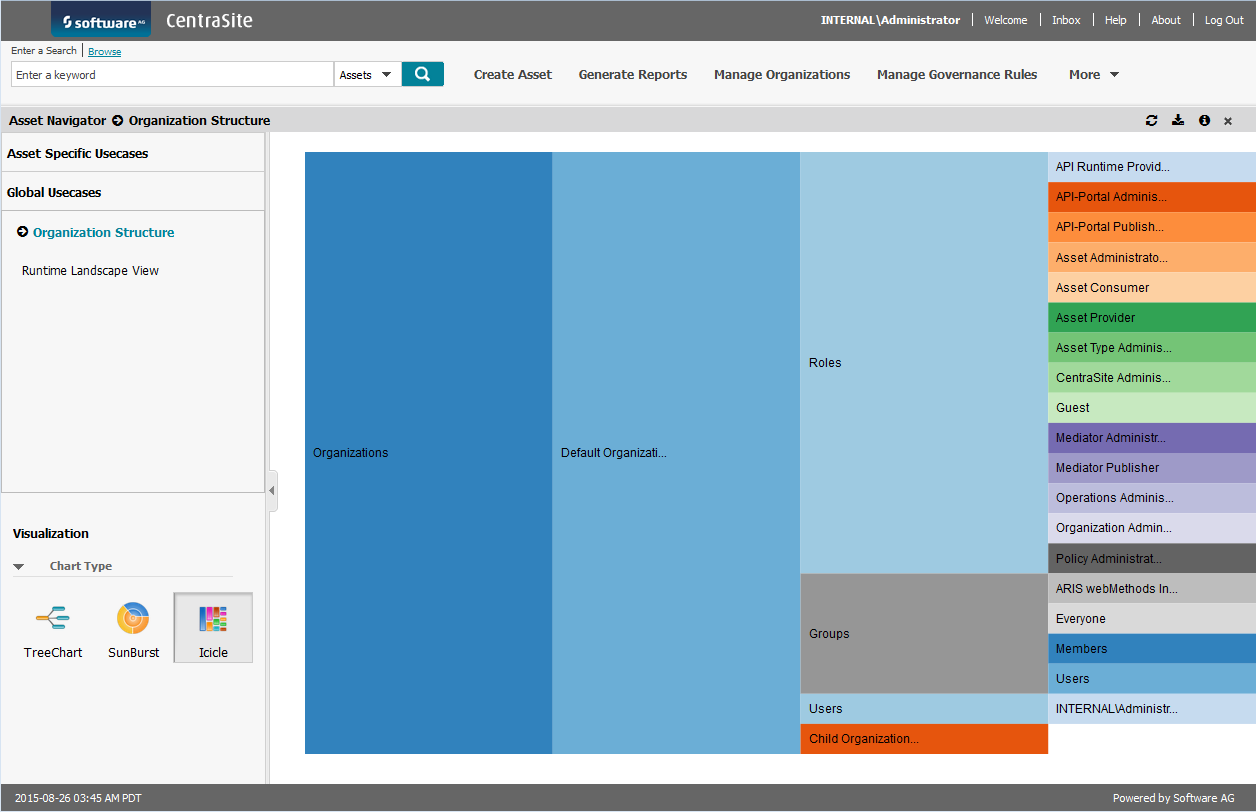
You can use the Icicle chart to get an overview of the hierarchical representation in just one glance. You can easily determine which call in the subtree consists of more data from the view. Here is an example of the Icicle diagram for the organizations.
You can click anywhere to zoom in, or click on the top bar to zoom out.