
Icons and Lines | Description |
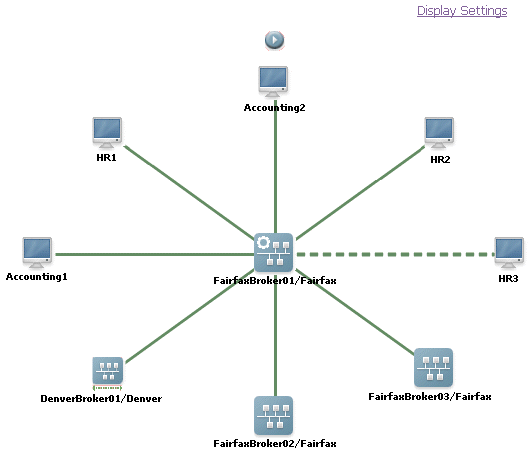
 | The current Broker. This is the Broker for which you are viewing details. You determine the labels that appear in the topology view for a Broker by defining display settings. For more information, see
Setting Your User Preferences for
the Display Settings. |
 | Remote Broker s. You determine the labels that appear in the topology view for a remote Broker by defining display settings. For more information, see
Setting Your User Preferences for
the Display Settings. You can switch to the details for a Broker in the display and view its topology view by clicking on the icon for a Broker. |
 | Gateway Broker, that is, a Broker in another territory where there is a gateway between the Broker and the current Broker. You determine the labels that appear in the topology view for a Broker by defining display settings. For more information, see
Setting Your User Preferences for
the Display Settings. You can switch to the details for a Broker in the display and view its topology view by clicking on the icon for a Broker. |
 | Client. You determine the labels that appear in the topology view for a client by defining display settings. For more information, see
Setting Your User Preferences for
the Display Settings. |
 | Active connection. A solid green line indicates that a connection has been made between the current Broker and the client or remote Broker. |
 | Disconnected connection. A dotted green line indicates that the connection could not be made between the current Broker and the client or remote Broker. You determine whether the topology view contains disconnected Brokers or clients by defining display settings. For more information, see
Setting Your User Preferences for
the Display Settings. |
 | Connection error. A solid red line indicates that a connection cannot be made due to a denied permission. |
 | The start trace button. Use this button to animate the topology view allowing you to trace documents actively flowing across client connections. For more information, see
About Tracing Documents in Broker Topology View. |
 | The stop trace button. Use this button to stop the document trace in the topology view. |