Icons and Lines | Description |
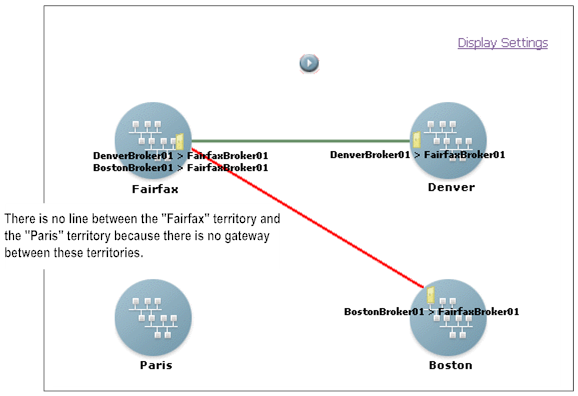
 | A territory without a gateway Broker. An icon for a territory that does not have a yellow door on it represents a territory without a gateway Broker. |
 | A territory with a gateway Broker. An icon for a territory with a yellow door on it represents a territory with a gateway Broker. The yellow door represents the gateway Broker. You determine whether to include information about gateway Brokers in the topology view. The label indicates the names of the gateway Brokers and the direction of the gateway. For example, the label in the following sample indicates:  For more information about how to include information about gateway Brokers in the territory topology view, see
Setting Your User Preferences for
the Territory Topology View. |
 | Active gateway connection. A solid green line represents a gateway between two territories where the permissions are set up properly. |
 | Gateway connection error. A solid red line indicates that there is a problem with the permission setup for a gateway between the two territories. |
 | The start trace button. Use this button to animate the topology view allowing you to trace documents actively flowing across gateways. For more information, see
About Tracing a Document in the
Territory Topology View. |
 | The stop trace button. Use this button to stop the document trace in the topology view. |