
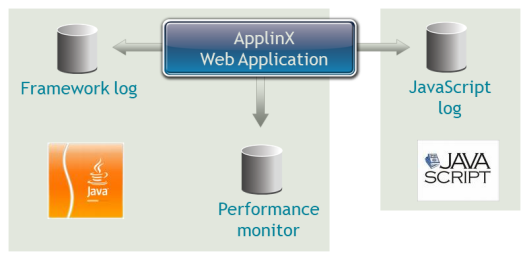
ApplinX provides a total of seven log files, four on the server side and three on the web application side. These logs are based on Log4j and as such are highly customizable. ApplinX log files have multiples uses:
For an application in production, log files are an important instrument for administrators.
Log files are also important for problem analysis, debugging, and performance analysis.
This document provides information on the various log files available with ApplinX and covers the following topics:
Usually, there are two servers where a log is produced:
the ApplinX server
the application server hosting the ApplinX web application (e.g. Tomcat)
Log files are plain ANSI text files. Most of the log files in ApplinX are created with Log4J, which means you can customize logging in ApplinX with standard Log4J configuration files. These are the two most important:
gxlog_config.xml
for the ApplinX Server side, see Log Files on the ApplinX Server Side
gx_logConfig.xml
for the Web application side, see Log Files on the Web Application Side
This section covers the following topics:
See also Viewing Server Logs in the Administration documentation.
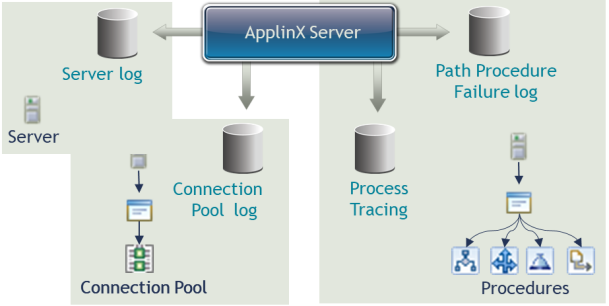
There are four log files on the server side:
Server Log
This is the main log file of the ApplinX Server. It includes general log data for all applications available on the server
(e.g. server startup and shutdown, application loading, session start and end). Its log level can be configured on the level
of the ApplinX Server.  More info
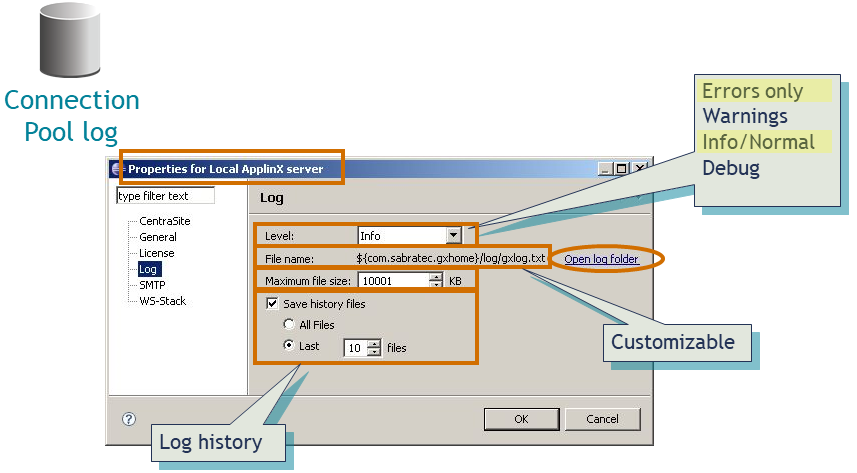
Connection Pool Log
This adds log data specific to Connection Pools to the same file as the Server log. It can be enabled or disabled on the level
of a single Connection Pool of an application. More info
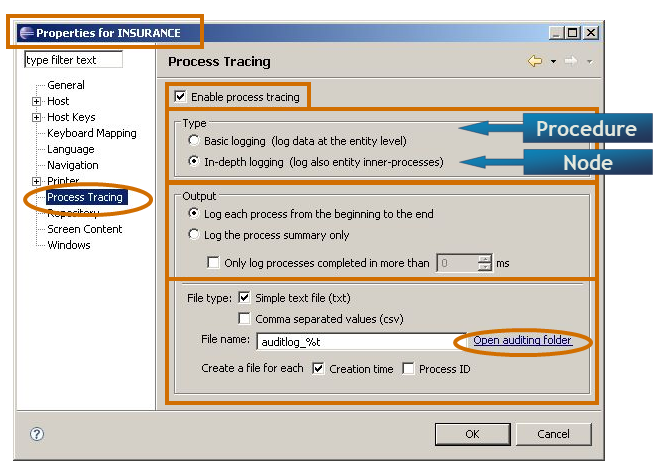
Process Tracing
This is about performance (it shows execution times of procedures), and is enabled or disabled on the level of a single application.
It adds log data specific to procedures (path, flow, etc.). More info
Path Procedure Failure log
This can be enabled on the level of the ApplinX Server to obtain a dump of a failing procedure. More info
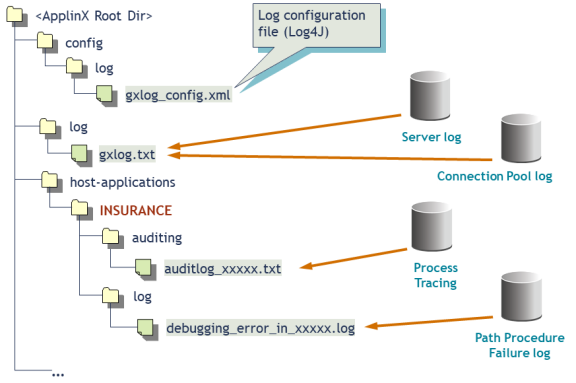
The following graphic shows the location of the log configuration file and the individual log files.
Log Configuration File
File gxlog_config.xml is a standard Log4J configuration file located in the config/log folder inside the ApplinX root installation directory.
Server log File
By default this file is called gxlog.txt and is located in the log subfolder of the ApplinX root directory.
Connection Pool Log
This file adds entries specific to Connection Pools to the same file, that is, gxlog.txt.
The other two log files are created per application:
Process Tracing File
You can specify the name of this file when you enable process tracing. Its format format can be .txt or .csv. It's name may
include time (%t) or the process ID (%p). By default, it is created in the auditing subfolder of the application's directory. In our example, in the auditing subfolder of the host-applications/INSURANCE folder.
Path Procedure Failure Log
When enabled, this file is named debugging_error_in_xxxxx.log by default and includes the name of the failing procedure, the session ID and the time. By default, it is located in the
"log" subfolder of the application's directory.
Names and locations of all log files can be customized in the log configuration file gxlog_config.xml.
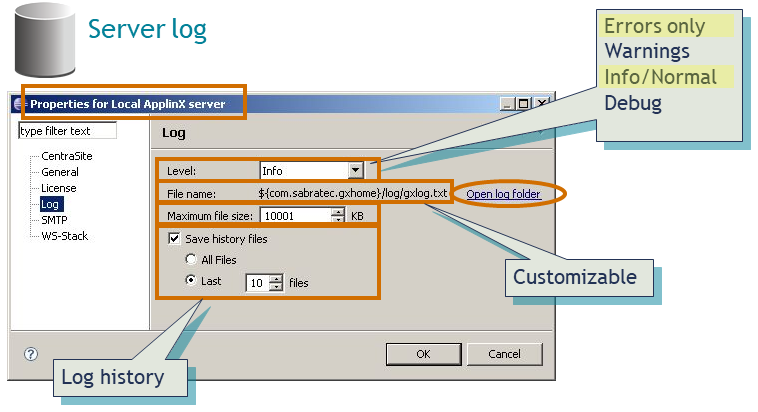
The Server log is the main log file of the ApplinX Server. It supports multiple log levels and log history.
 To configure the Server log file
In ApplinX Designer, go to the properties of the server (for example "Local ApplinX server"), and select the Log node.
You can change the following settings:
| Setting | Description |
|---|---|
| Level | The contents of the log file are as detailed as this property defines, where every level includes the levels above it. For
example: Debug level also includes Normal, Warnings and Errors Only levels.
By default, the level is "Info/Normal". For an application in production, log level "Errors only" is recommended. |
| File name | The log is written to the file displayed here. File name and location can be customized in the Log configuration file (gxlog_config.xml). |
| Open log folder | Enables you to see the list of existing log files. |
| Maximum file size | Starts a new log file after the current file has been filled to the maximum file size. |
| Save history files |
|
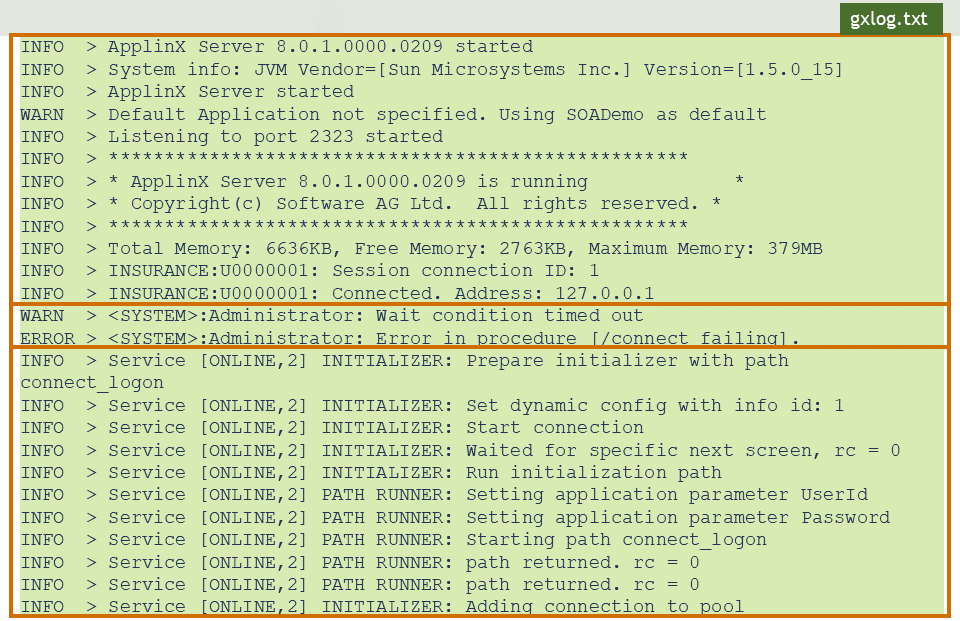
This example shows a Server log with log level "Info". It shows Server startup logging at the beginning. It also shows a Warning about a wait condition that timed out (e.g. a path waits for a specific screen ID), and an error of a failing procedure.
The next portion of lines shows the Connection Pool Log of a Connection Pool. The Connection Pool Log level shown here is "Debug", so we see detailed information about the startup phase of the Connection Pool (e.g. execution of the initialization path).
The Connection Pool Log adds Connection Pool specific information to the Server Log file (gxlog.txt by default). It is used for fine-tuning Connection Pool parameters or identifying problems of the different Connection Pools.
To configure the Connection Pool Log using the ApplinX Administrator
In the ApplinX Administrator, under , right-click on the Connection Pool for which the Connection Pool Log is to be enabled.
Choose and find the log level on the General tab.
To configure the Connection Pool Log using the ApplinX Designer
In the ApplinX Designer, open the Connection Pool entity.
On the General tab, you can set the Log level of the Connection Pool Log.
You can set a different detail of logging for each Connection Pool: None, Errors, Warnings, Information and Details. Once the application is in production, the level Error (which is the default) is recommended. The Server log should be set to no less than level Info/Normal in order to see Connection Pool Logs.
Note:
No restart is required if you change the Connection Pool Log configuration.
See example above and also Viewing Server Logs in the Administration documentation.
Application Process Tracing is used to provide a log of performance times of processes such as procedures, paths and programs. It is particularly helpful in SOA-enablement applications. This can give a more specific indication (pinpoint the exact process) as to the cause of application performance problems. The application process tracing information can be saved as a .txt and/or .csv file.
Note:
The host times that the tracing application process displays are only relevant for hosts that are not character mode hosts
(e.g. not VT).
To configure Process Tracing
In the ApplinX Designer, get to the application's properties and select the Process Tracing node. You can change the following settings:
| Setting | Description |
|---|---|
| Enable process tracing | Check this box to activate process tracing in your application. |
| Type | Select the type of tracing you require: either basic logging, which logs the data at the entity level (logs when a procedure, path or program started and when they were completed) or in depth logging, which logs more detailed data, at the step or node level. |
| Output | Select whether to log each process from the beginning to the end or just to log a summary of the process. When logging just the process summary, it is possible to define to only log processes that took longer than a certain amount of time to be completed. |
| File type | Indicates whether to display the logged data in a simple text file (.txt) and/or as comma-separated values (.csv) format. |
| File name | The name of the trace file. You can create a separate File for each session, or connection and the name can include the creation
time and/or process ID.
%t will insert the time stamp of the connection.
%p will insert the process ID (connection or session ID).
|
| Open auditing folder | Opens the Windows Explorer and displays the location and list of existing files. |
Note:
No restart is required if you change the Process Tracing configuration.
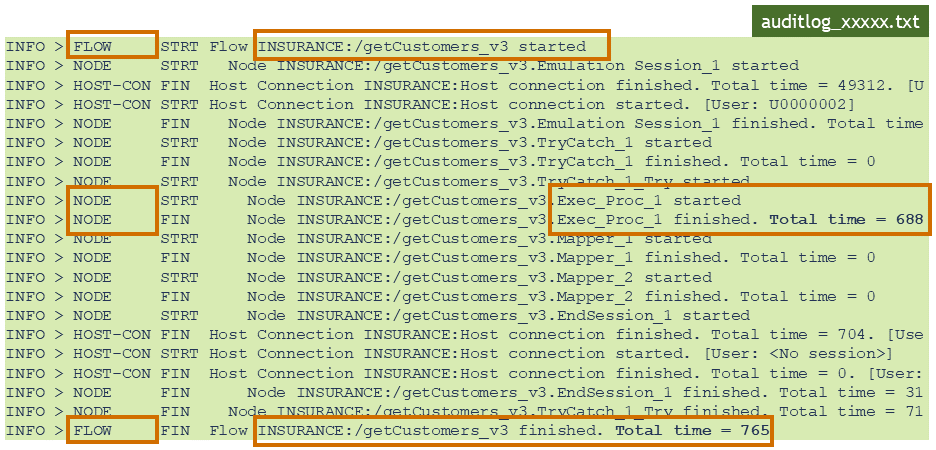
This example of Process Tracing shows the trace from running a flow procedure named "getCustomers_v3". The outcome is, that executing this procedure took 765 ms in total. As the log level used was in-depth logging, the trace also contains execution times for the single nodes inside the Flow Procedure. One of these nodes is about executing a Path Procedure, which takes 688 ms … this is close to 90% of the total execution time of the procedure.
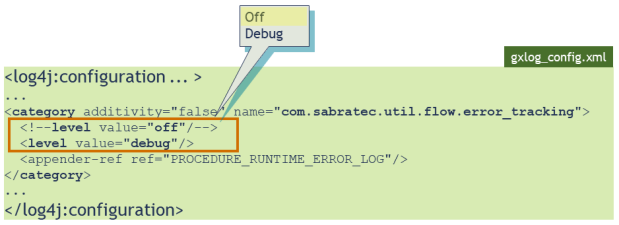
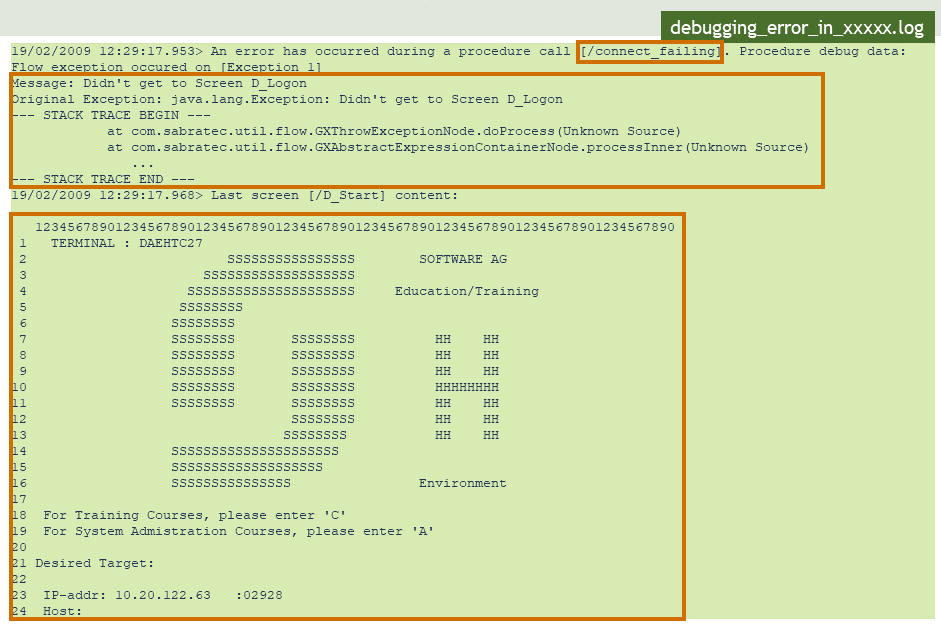
The Path Procedure Failure log includes debug data regarding procedures that fail in runtime. The log includes a snapshot in ASCII characters of the screen that caused the failure.
To configure a Path Procedure Failure Log
In the Log Configuration file (gxlog_config.xml),
search for the <category> tag with name "com.sabratec.util.flow.error_tracking", and change the value in the <level> tag from "off" to "debug".
The name of the created log file will include identifying information about the user and the failing procedure, and a timestamp.
Restart the ApplinX server for these changes to take effect.
By default the log is created in the <ApplinX home>/host-applications/<APPLICATION_NAME>/log directory,
and the file names will have the following format: debugging_error_in_%I_%t.log,
| where | %I |
identifies the user and procedure name, and |
%t |
is the timestamp. |
The location and name of the file can be changed in the gxlog_config.xml file.
Here is an example of a Path Procedure Failure log showing the following:
message that the execution of a procedure named "connect_failing" failed
a stack trace
snapshot of the current screen when the failure occurred
This section covers the following topics:
There are three log files on the web application side:
Framework Log
This is the main log file of an ApplinX web application. It includes general log data for all applications available on the
server (e.g. server startup and shutdown, application loading, session start and end). Its log level can be configured on
the level of the ApplinX Server. More info
Performance Monitor
This can be enabled to measure execution times and to analyze performance problems. More info
JavaScript Log
This log is used primarily to log JavaScript errors and also to debug specific modules of the JavaScript engine. More info
The following graphic shows the location of the log configuration files and the individual log files.
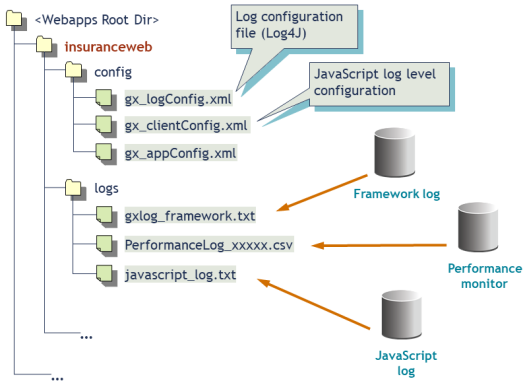
The following configuration files are standard Log4J configuration files located in the config subfolder inside the web application's root directory on the application server:
Web Log Configuration File
File gx_logConfig.xml contains all of the log configuration of the web application (with the exception of JavaScript).
JavaScript Log Configuration File
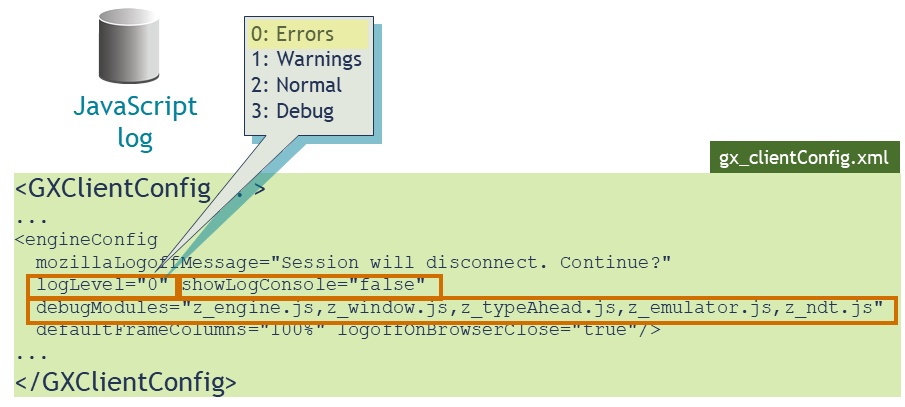
File gx_clientConfig.xml contains the configuration of the JavaScript log level.
The following log files are created by default in the logs subfolder of the web application's root directory:
Framework Log
This file, by default, is written to a file named gxlog_framework.txt.
Performance Monitor
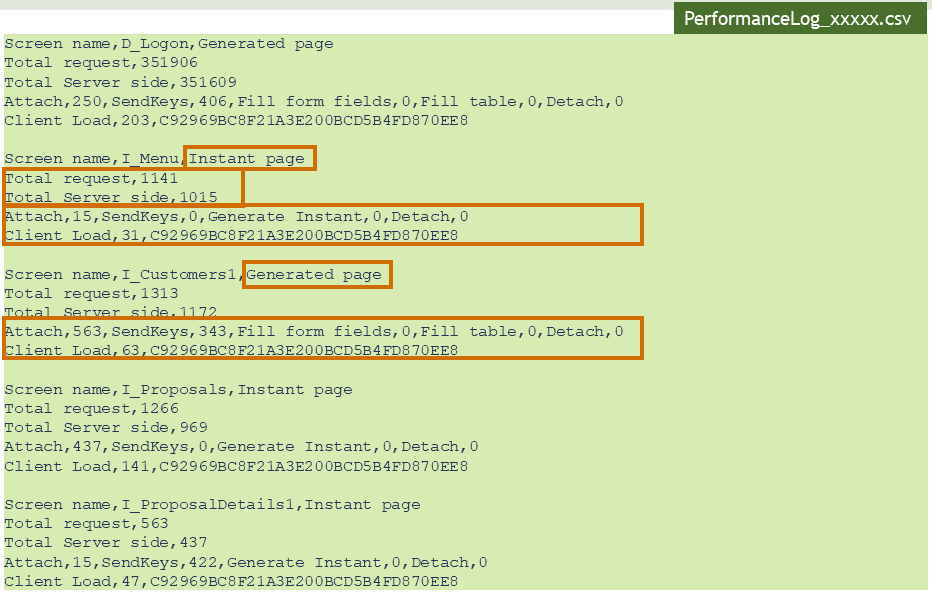
The Performance Monitor, when enabled, is written to a file named PerformanceLog_xxxxx.csv where the extension can also be .txt.
The file name may include the session ID.
JavaScript Log
This log is written, by default, to the file javascript_log.txt.
Names and locations of all three log files can be customized in the log configuration file gx_logConfig.xml.
The Framework log is the principal log file of the ApplinX Web Application. It supports multiple log levels and log history.
ApplinX provides a web-based Configuration Editor where you can configure framework parameters, including those for logging. See Web Application Configuration Parameters in the Web Application Development documentation.
You can use the ApplinX Framework log to analyze and debug the code in the Web application. This is implemented by making changes in the config/gx_logConfig.xml file. See Investigating the Web Application's Code in the Web Application Development for further details.
To configure the Framework log
Open a new browser and run your Web application.
On the ApplinX Framework starting page, click on the Configuration link. The Configuration Editor will be displayed.
Expand the node named Log and specify the following:
| Setting | Description |
|---|---|
| File name | The log file name and path relative to the web application's root directory. |
| Append to existing file | Check this box to append to an existing log file instead of starting a new one. |
| Log level | Multiple levels, from "Errors only" to "Debug" are supported. The "Normal" level is default and "Errors only" is recommended for an application in production. |
| Log history | Specify the maximum number of old log files to keep; when this number is reached, the oldest log history file is deleted when the next log history is created. |
| Max. file size | The maximum file size (in bytes) for a log file; when the log file reaches this limit, it is saved to a log history file, and a new Framework log is started. |
Remember to save your changes in the Configuration Editor.
Note:
No restart is required if you change the Framework log configuration.
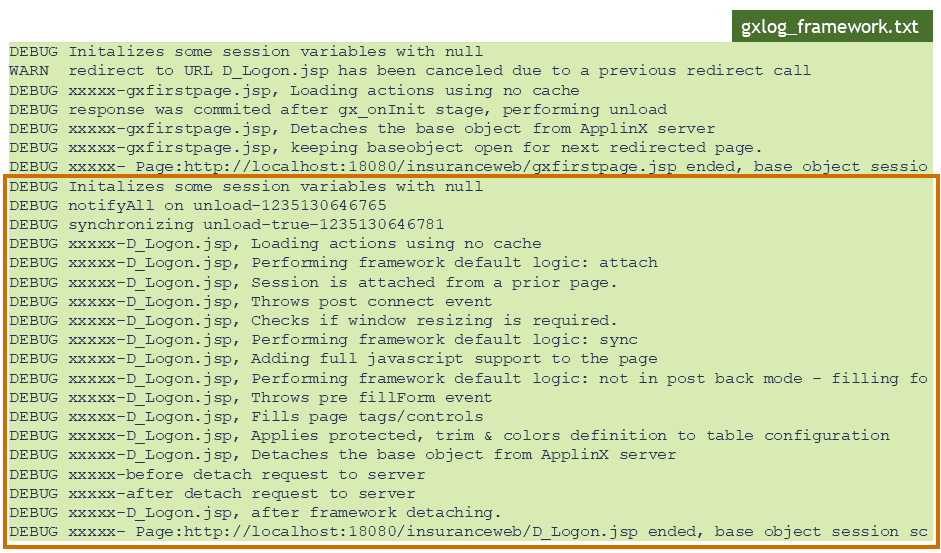
The following is an example of a Framework log. The log level in this case was set to "Debug", and the highlighted area shows the lifecycle trace created by a page named "D_Logon.jsp" when this was loaded.
The Performance Monitor can be enabled to measure execution times in an ApplinX web application. This can be helpful to analyze performance problems, for instance to find out whether time is consumed mostly in the web application or in the ApplinX Server.
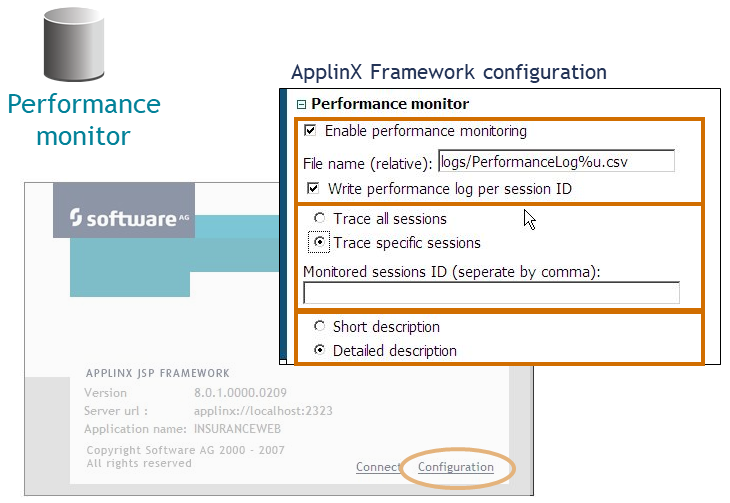
To enable and configure the Performance Monitor
Open the web-based Configuration Editor.
Expand the node named Performance monitor and specify the following:
| Setting | Description |
|---|---|
| Enable performance monitoring | Check this box to enable the Performance Monitor. |
| File name | The log file name and path relative to the web application's root directory. |
| Write performance log per session ID | Check this box to get a separate log file per session ID (%u is added to the file name). |
| Trace all/specific sessions | Specify here whether to take all sessions or only selected sessions into account. |
| Monitored sessions ID | If Trace specific sessions was selected, provide here a comma-separated list of the session IDs to monitor. |
| Short/detailed description | Select here the level of detail in the log. |
Remember to save your changes in the Configuration Editor.
Note:
No restart is required if you change the Performance Monitor configuration.
This example of a Performance Monitor log shows, for example, that loading of the page I_Menu.jsp took 1141 ms in total, 1015 ms of which were consumed at the ApplinX Server side (which is about 89% of the time).
It also shows additional times depending on the type of page (Instant and Generated page).
The JavaScript log is used to debug specific modules of the JavaScript engine. The engine logs JavaScript errors that occur to users of the web application. These errors are logged to the framework JavaScript log.
The JavaScript logger engine automatically logs JavaScript errors to the JavaScript log file. See JavaScript Logger Engine in the Web Application Development for more information.
To configure the JavaScript log
Open the configuration file gx_clientConfig.xml in an editor and search for the <engineConfig> tag.
In the logLevel attribute, set the log level:
0: Errors (default)
1: Warnings
2: Normal
3: Debug
If the showLogConsole attribute is set to true, the log output is also displayed in a log console in the browser.
The debugModules attribute specifies, as comma-separated values, the list of modules of the JavaScript engine to log. These modules are:
JavaScript engine core (z_engine.js)
Modal Windows (z_window.js)
Type ahead (z_typeAhead.js)
Emulation (z_emulator.js)
Natural Data Transfer (z_ndt.js)
Note:
No restart is required if you change the JavaScript Log configuration.
This example shows how the JavaScript Log Console, when enabled, is displayed inside the browser window:
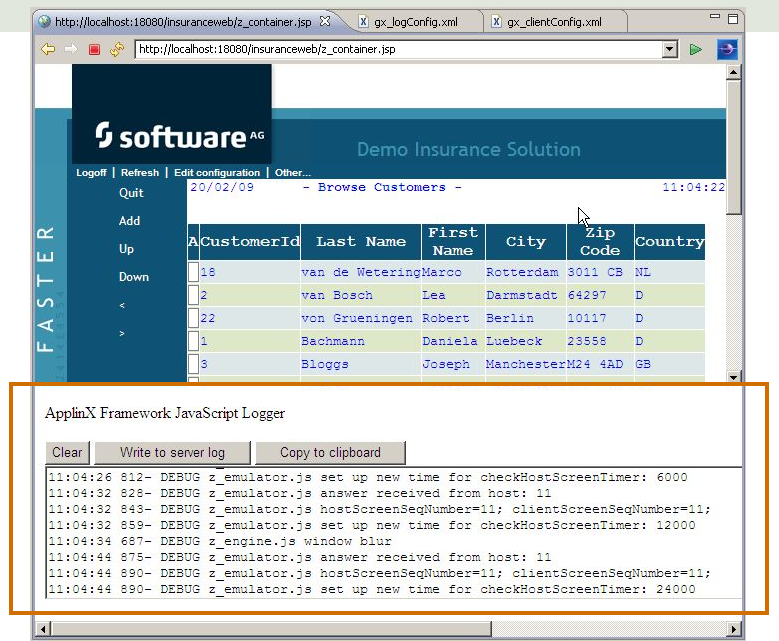
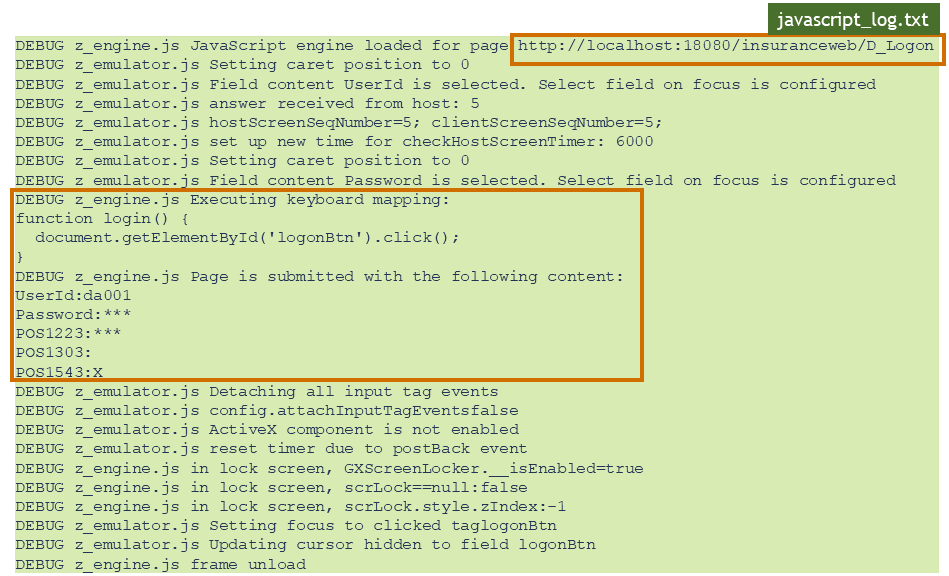
This is an example of a JavaScript log created from the page D_Logon.jsp.
The fragment in the middle shows the tracing of the action of pressing the Enter key, which is mapped to a click on the button.
The following logging and tracing possiblities are also provided:
The GCT Trace File log enables recording a file, which traces the connection communication (connection pool or user) between the ApplinX server and the host, for each connection. It is possible to define whether a single trace file will be created, replacing the previously saved file or whether the data will be saved to a new file on every new connection or session. Identifying the separately saved files is possible by inserting identifying parameters in the file name (the session ID, creation time and/or connection ID). It is highly recommended to create a separate file for each session/connection or creation time. Note that trace files can be created from within the session definition overriding the application definition. This is recommended as it does not conflict with other existing sessions.
Refer to Recording Trace Files for more information.
Refer to the Session View for details regarding overriding application properties per session and also for details on navigating within a session in replay mode.
The Host Print Log logs information regarding the printing activity. This
information can be displayed by clicking on the button.
There are two log levels which can be set: normal (default) or debug.
The loglevel parameter determines the log level.