The performance tools can be used to test the performance of a web application. First, you record a performance trace (that is, your interaction with the server), and then you execute the recorded performance trace in order to determine the amount of time that is required for processing the server requests.
This document covers the following topics:
Performance traces are recorded using the Start/Stop Trace tool.
 To record a performance trace
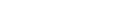
In the Performance Tools node of the navigation frame (which is visible when the button has previously been chosen), choose Start/Stop Trace.
The following dialog appears.
The Trace Directory text box indicates the directory in which the traces will be stored. The name of this directory is defined in the file cisconfig.xml.
Each trace is written into a separate subdirectory of the trace directory. The name of the subdirectory is determined by your specification in the Trace Name text box.
Note:
Make sure that the trace directory is available at the
specified location. Otherwise, traces will not be written.
Enter the name of a subdirectory in the Trace Name text box.
Choose the Start Recording button.
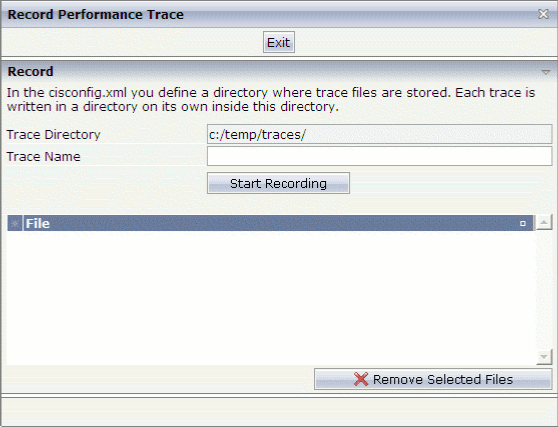
Additional information is now shown in the dialog.
In the Next Request's Comment text box, enter a comment name for the current trace.
Using comment names, you can subdivide the trace into several sections. The comment name is used in the names of the files that are created for your server requests (see below).
Choose the button.
The comment name that you specified is shown below the Next Request's Comment text box.
Initiate an interaction with the server.
For example, open the Layout Manager by choosing the corresponding entry in the navigation frame, and then return to the above dialog by choosing Start/Stop Trace in the navigation frame.
All requests (interactions with the server) that you initiate are recorded.
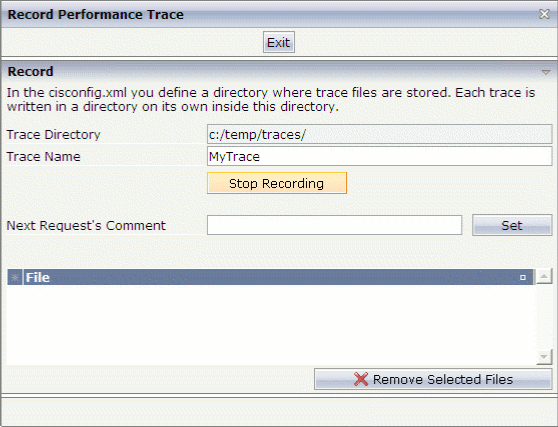
Choose the Stop Recording button.
The files that have been created for your requests are shown in the dialog. The comment name that you specified is part of the file name.
If you want to remove one or more files from the list, select the file(s) and choose the button.
You can add further requests to this trace by repeating the above steps.
Recorded performance traces are executed using the Execute Trace tool.
To execute a performance trace
In the Performance Tools node of the navigation frame (which is visible when the button has previously been chosen), choose Execute Trace.
The following dialog appears.
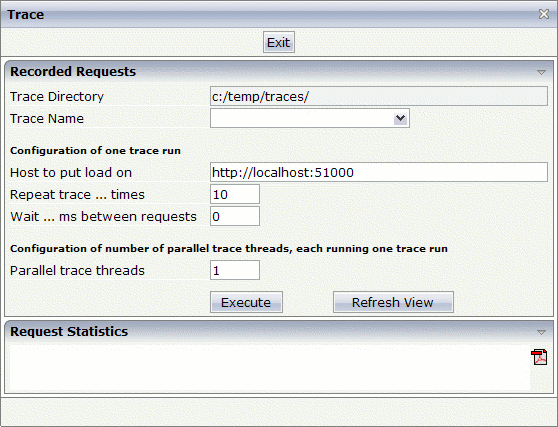
The Trace Directory text box indicates the directory in which the tool looks for the recorded traces.
Specify the following information:
- Trace Name
Select the name of the subdirectory which contains the recorded traces for your server requests.
- Host to put load on
Enter the URL of the host on which you want to execute the trace.
- Repeat trace ... times
Enter the number of times that the trace is to be repeated.
For all defined repetitions, the average process time (in milliseconds) will be shown in the request statistics (see below). The more repetitions you define, the more conclusive is the resulting average value.
- Wait ... ms between requests
Enter the waiting time between the requests in milliseconds.
- Parallel trace threads
Enter the number of parallel trace threads. This simulates the number of users that access the web application at the same time.
Choose the button.
Choose the button to display the request statistics at the bottom of the dialog.
Information on the requests is now shown in the Request Statistics section:
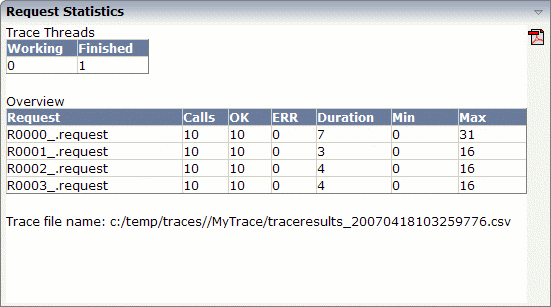
The first small table indicates the current number of unfinished and finished trace threads.
The second table provides a statistical evaluation of the executed requests. The following information is provided for each request: the number of calls, the number of successful executions, the number of errors, the average process time for all calls (duration), the minimum process time for a call, and the maximum process time for a call. The times are given in milliseconds.
In the case of an error, an additional table is shown which provides details on the error.
You can choose the following button in the Request Statistics section to display the request statistics in PDF:
![]()
The trace result is stored in a CSV file. The path to this file is indicated at the bottom of the dialog.