
The reporting functions you got to know in this part enable you to do reporting output including interactive grids, texts and graphics. Before directly using them inside your programs, you should think about setting up a certain abstraction layer on top of the functions that has a higher degree of semantic relationship with your application.
What do we mean? Let us explain by example:
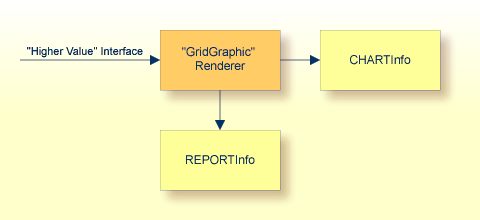
Imagine you often have the situation of showing grids of data together with a certain graphic. In this case, you could think about writing a "report renderer" that rceives an array of values and that produces grid and graphics in one step. It internally uses the APIs of Application Designer reporting:
Maybe you even can embed some data collection functions into your "report renderer" functions that pick certain data from a data source and immediately transfer this data into a reporting output.
In other words: the Application Designer functions for reporting are technical rendering functions. Not less - and not more!