JSwat is a graphical debugger, available free of charge - see http://www.bluemarsh.com/. It is not restricted to any development environment - but is a standalone debugging environment. It is flexible to use and can be used e.g. in a customer environment where you do not want to install a full development environment in order to trace and debug your applications. JSwat is written in Java and also runs on Linux-based systems.
We strongly recommend to use this debugger instead of using a
System.out.println() way for debugging.
JSwat supports remote debugging by the Java JPDA architecture. This means, you start Application Designer with some flags to force the virtual machine that it sends debug information to interested listeners. JSwat acts as listener for this information.
The following topics are covered below:
There is a special batch file available for starting the default Application Designer in remote debugging mode. Have a look at the file <installdir>\bin\GUIServer_remote.bat:
cd..
cd tomcat
cd bin
set java_home=..\..\jre
set catalina_home=..
set jpda_transport=dt_socket
set jpda_address=5000
catalina jpda run
You see that
the Tomcat 4.0 (Catalina) environment is started with the option "jpda";
the transport protocol is "dt_socket" at port "5000"
After starting Application Designer with these options, it runs in debug mode, i.e. remote debuggers can connect by TCP/IP to the virtual machine.
After starting JSwat, configure two items:
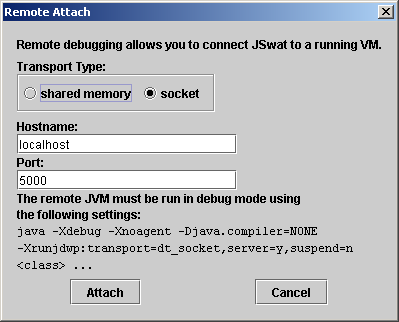
Connect the JSwat debugger to Application Designer, running in debug mode.
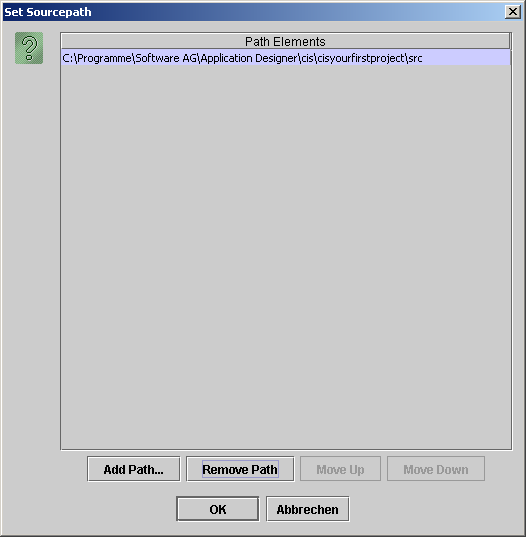
Tell JSwat where the sources of your classes are located.
The connection to Application Designer is done by inside JSwat. Select the parameters according to the definition inside the <installdir>\bin\GUIServer_remote.bat file:
The source path is maintained by . In the dialog, define the location of your sources.
See the JSwat documentation for details on how to use JSwat.