This document contains information about using VML (Vector Markup Language) chart controls. Since we introduced a rich set of charting functions in a previous release which is based on a SVG (Scalable Vector Graphics) charting library, we clearly recommend new users to use the SVG functions:
SVG is a W3C standard and is widely supported by common browser plugins (e.g. Adobe Reader).
SVG is easily integratable into other reporting functions.
SVG is easily integratable into PDF/FOP generation functions.
SVG can be easily transferred into other formats (e.g. JPG).
Of course, the controls in the VML area are still available - this appendix contains the documentation.
There are controls available to allow the dynamic drawing of charts. Currently, the following chart types are available:
Bar Chart
Line Chart
Point Chart
Pie Chart
The principal paradigm of drawing these charts is the same as it is everywhere inside Application Designer: an adapter provides the content data to be displayed. The data are transferred to the browser which renders these data into graphical charts.
The technology used inside the browser for rendering graphics is VML - Vector Markup Language. VML is available inside the Internet Explorer at Release 5.0 without any further plugins. Vector graphics are in the process of standardization by the W3C - there is a standard SVG 1.0 (Scalable Vector Graphics) which is a superset of VML. Currently, an SVG viewer is needed inside your browser to be able to view SVG graphics. Application Designer may decide in future to switch to SVG when it is supported as a standard by all browsers. Interfaces of your adapter and Application Designer control specifications are completely independent from this.
All controls dealing with vector graphics hold tags with names starting with "VEC". The controls are available as "ROW" controls, i.e. inside a container, add them as a table row.
The following topics are covered below:
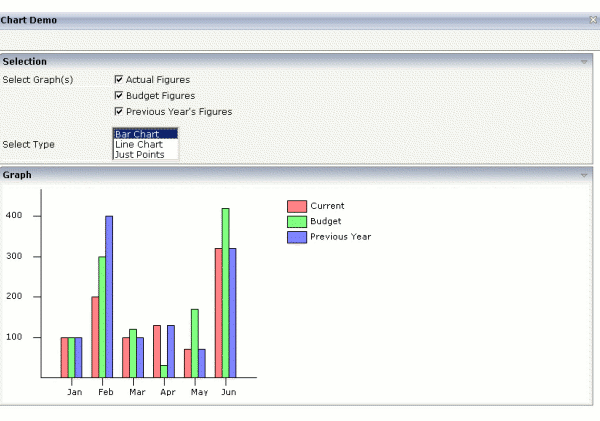
The VECHBARS control is a chart control to draw:
Bar Charts
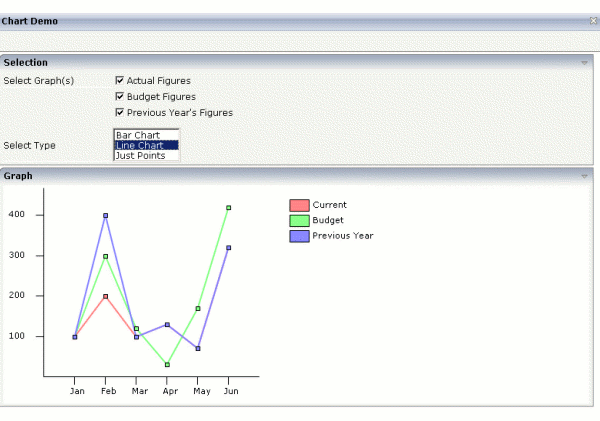
Line Charts
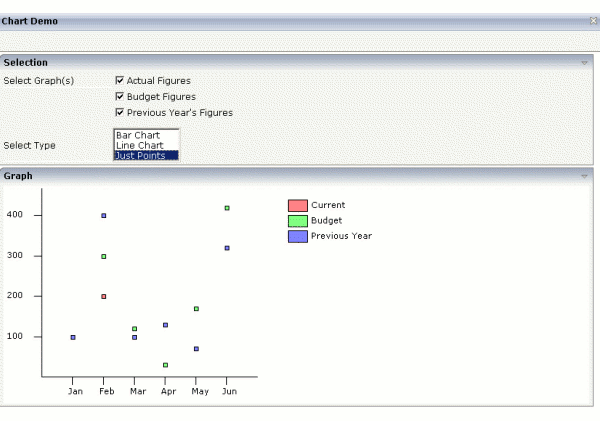
Point Charts
The adapter object has to provide the following data by properties:
The titles which represent the names to be used as scale for the x-axis.
The values representing the lines.
The name of each line used for the legend.
For efficient transfer of these data, comma separated value (CSV) strings are used - with semicolon as the separator.
In the tag definition, the additional specifications need to be done:
Pixel height of the chart.
Pixel scale used for the x-axis.
The type of the chart (bars/ lines/ points) can either be set statically or dynamically - by an adapter property.
The following topics are covered below:
| VECHBARS | ||
| TITLESPROP |
Name of the adapter property which provides a CSV string containing the titles of the x-axis. |
Obligatory |
| VALUESARRAY-PROP |
All lines are represented by an array of items at adapter side – each line is represented by one item inside the array. E.g. if you want to display 3 lines then you have to provide an array of 3 items. The array item itself has to provide one property representing the number values and one property representing the name of this line. The VALUSARRAYPROP is the name of the adapter property returning the array. |
Obligatory |
| VALUESITEM-PROP |
This is the name of the property inside an array item, providing a CSV string to hold the number values for the corresponding line. |
Obligatory |
| VALUESNAME PROP |
This is the name of the property inside an array item providing the name of the line which is shown inside the legend of the chart. |
Obligatory |
| PIXELHEIGHT |
The total pixel height of the chart. |
Obligatory |
| XPIXELSCALE |
The number of pixels to be used as a distance between the x-axis-items. |
Optional |
| DISPLAYTYPE |
Defines if the chart is rendered as a bar char, line chart or point chart. There are three values supported: "BARS", "LINES", "POINTS". |
Optional |
| DISPLAYTYPE-PROP |
If the display type should be dynamically, specify this property. It represents the name of the adapter property to provide the string information what display type should be used; again either "BARS", "LINES" or "POINTS". If you specify both DISPLAYTYPE and DISPLAYTYPEPROP properties, the dynamic definition is taken instead of the static definition. |
Optional |
The following XML layout definition and adapter code represent the example you saw at the beginning of this chapter.
The layout definition looks as follows:
<page model="BarChartAdapter">
<titlebar name="Chart Demo">
</titlebar>
<header withdistance="false">
<button name="Exit" method="endProcess">
</button>
</header>
<pagebody>
<rowarea name="Selection">
<itr>
<label name="Select Graph(s)" width="150">
</label>
<checkbox valueprop="showActual" flush="server">
</checkbox>
<label name="Current Figures" asplaintext="true">
</label>
</itr>
<itr>
<hdist width="150">
</hdist>
<checkbox valueprop="showBudget" flush="server">
</checkbox>
<label name="Budget Figures" asplaintext="true">
</label>
</itr>
<itr>
<hdist width="150">
</hdist>
<checkbox valueprop="showPrevious" flush="server">
</checkbox>
<label name="Previous Year's Figures" asplaintext="true">
</label>
</itr>
<vdist pixelheight="10">
</vdist>
<itr>
<label name="Select Type" width="150">
</label>
<combofix valueprop="displayType" size="3" flush="server">
<combooption name="Bar Chart" value="BARS">
</combooption>
<combooption name="Line Chart" value="LINES">
</combooption>
<combooption name="Just Points" value="POINTS">
</combooption>
</combofix>
</itr>
</rowarea>
<rowarea name="Graph" height="100%">
<vechbars titlesprop="titles" valuesarrayprop="lines" valuesitemprop="figures"
nameitemprop="name" pixelheight="300" xpixelscale="40"
displaytypeprop="displayType">
</vechbars>
</rowarea>
</pagebody>
<statusbar withdistance="false">
</statusbar>
</page>
The display type is derived dynamically from the property
displayType - and is not set statically. The
corresponding adapter code looks as follows:
// This class is a generated one.

import java.util.Vector;

import com.softwareag.cis.server.Adapter;

public class BarChartAdapter
    extends Adapter
{
    // ------------------------------------------------------------------------
    // inner classes
    // ------------------------------------------------------------------------
    public class Line
    {
        String m_figures;
        String m_name;

        public Line(String figures, String name)
        {
            m_figures = figures;
            m_name = name;
        }
        public String getFigures() { return m_figures; }
        public String getName() { return m_name; }
    }

    // ------------------------------------------------------------------------
    // property access
    // ------------------------------------------------------------------------

    String m_titles = "Jan;Feb;Mar;Apr;May;Jun;Jul;Aug;Sep;Oct;Nov;Dec";
    String m_actualFigures = "100;200;100;130;70;320;100;130;100;250;100;130";
    String m_budgetFigures = "100;300;120;30;170;420;90;130;80;200;120;439";
    String m_previousFigures = "100;400;100;130;70;320;100;130;500;250;100;130";

    boolean m_showActual = true;
    boolean m_showBudget = true;
    boolean m_showPrevious = true;

    String m_displayType = DT_BARS; // default display type = BAR-Chart

    // ------------------------------------------------------------------------
    // public adapter methods
    // ------------------------------------------------------------------------

    public String getDisplayType() { return m_displayType; }
    public void setDisplayType(String value) { m_displayType = value; }

    public boolean getShowActual() { return m_showActual; }
    public void setShowActual(boolean value) { m_showActual = value; }

    public boolean getShowBudget() { return m_showBudget; }
    public void setShowBudget(boolean value) { m_showBudget = value; }

    public boolean getShowPrevious() { return m_showPrevious; }
    public void setShowPrevious(boolean value) { m_showPrevious = value; }

    public String getTitles() { return m_titles; }

    public Object[] getLines()
    {
        Vector v = new Vector();
        if (m_showActual == true) v.addElement(new Line(m_actualFigures,"Current"));
        if (m_showBudget == true) v.addElement(new Line(m_budgetFigures,"Budget"));
        if (m_showPrevious == true) v.addElement(new Line(m_previousFigures,"Previous Year"));
        Line[] result = new Line[v.size()];
        v.copyInto(result);
        return result;
    }
}
The array property lines returns the
information for each line. Each item is an instance of the (inner) class
Line, providing the properties
figures and name. The
type of chart is returned by displayType.
The VECPIE control allows drawing pie charts.
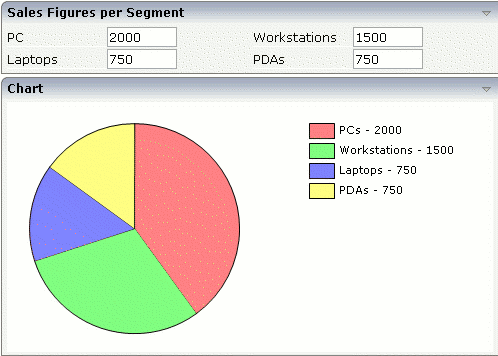
The adapter object has to provide the following data:
The values representing the pie chart portions.
The names used in the legend.
Inside the control definition, define the following additional information:
The pixel height of the chart.
As in the VECHBARS controls, comma separated value strings are used for efficient data transfer.
The following topics are covered below:
| VECPIE | ||
| TITLESPROP |
Name of adapter property to provide a CSV string, representing the titles to be displayed inside the legend. |
Obligatory |
| VALUESPROP |
Name of adapter property to provide a CSV string, representing the values of the chart. The number of values in the CSV string must be the same as the number of titles. |
Obligatory |
| PIXELHEIGHT |
Pixel height of the control. |
Obligatory |
The layout definition and the adapter code of the screen shot are:
<rowarea name="Sales Figures per Segment">
    <tr>
        <label name="PC" width="100">
        </label>
        <field valueprop="pcSales" flush="server" length="9" datatype="int">
        </field>
        <hdist>
        </hdist>
        <label name="Workstations" width="100">
        </label>
        <field valueprop="workstationSales" flush="server" length="9" datatype="int">
        </field>
    </tr>
    <tr>
        <label name="Laptops" width="100">
        </label>
        <field valueprop="laptopSales" flush="server" length="9" datatype="int">
        </field>
        <hdist>
        </hdist>
        <label name="PDAs" width="100">
        </label>
        <field valueprop="pdaSales" flush="server" length="9" datatype="int">
        </field>
    </tr>
</rowarea>
<rowarea name="Chart">
    <vecpie titlesprop="titles" valuesprop="values" pixelheight="250">
    </vecpie>
</rowarea>
and:
import com.softwareag.cis.server.Adapter;

// This class is a generated one.

public class PieChartAdapter
    extends Adapter
{
    int m_pcSales = 2000;

    public void setPcSales(int value) { m_pcSales = value; }
    public int getPcSales() { return m_pcSales; }

    int m_workstationSales = 1500;
    public void setWorkstationSales(int value) { m_workstationSales = value; }
    public int getWorkstationSales() { return m_workstationSales; }

    int m_laptopSales = 750;
    public void setLaptopSales(int value) { m_laptopSales = value; }
    public int getLaptopSales() { return m_laptopSales; }

    int m_pdaSales = 750;
    public void setPdaSales(int value) { m_pdaSales = value; }
    public int getPdaSales() { return m_pdaSales; }

    public String getTitles()
    {
        return "PCs;Workstations;Laptops;PDAs";
    }

    public String getValues()
    {
        return m_pcSales+";"+m_workstationSales+";"+m_laptopSales+";"+m_pdaSales;
    }
}
The CSV string to represent the values is dynamically built out of the
input of the fields "pcSales",
"workstationSales",
"laptopSales" and
"pdaSales". In the layout definition, the
corresponding FIELD tags are specified with FLUSH="server" - this
means, that the pie chart is updated every time the user changes a field (which
is fine in LAN scenarios, but maybe not in WAN scenarios).