Debug an API
Why Debug an API?
Debugging an API allows faster identification and debugging of failed runtime requests.
The tracer in API Gateway has the debugging capability which, when enabled, lists the API requests made. Tracer supports runtime request life cycle monitoring in API Gateway. Inspecting the failed runtime requests helps you to debug and troubleshoot your API calls.
Note:
You can only trace REST, SOAP, and OData API calls.
Before you begin
Ensure that you have:
Manage APIs or Activate /Deactivate API's functional privileges.
1. Create a REST API by importing an API from a URL

Click
APIs in the title navigation bar.
Click
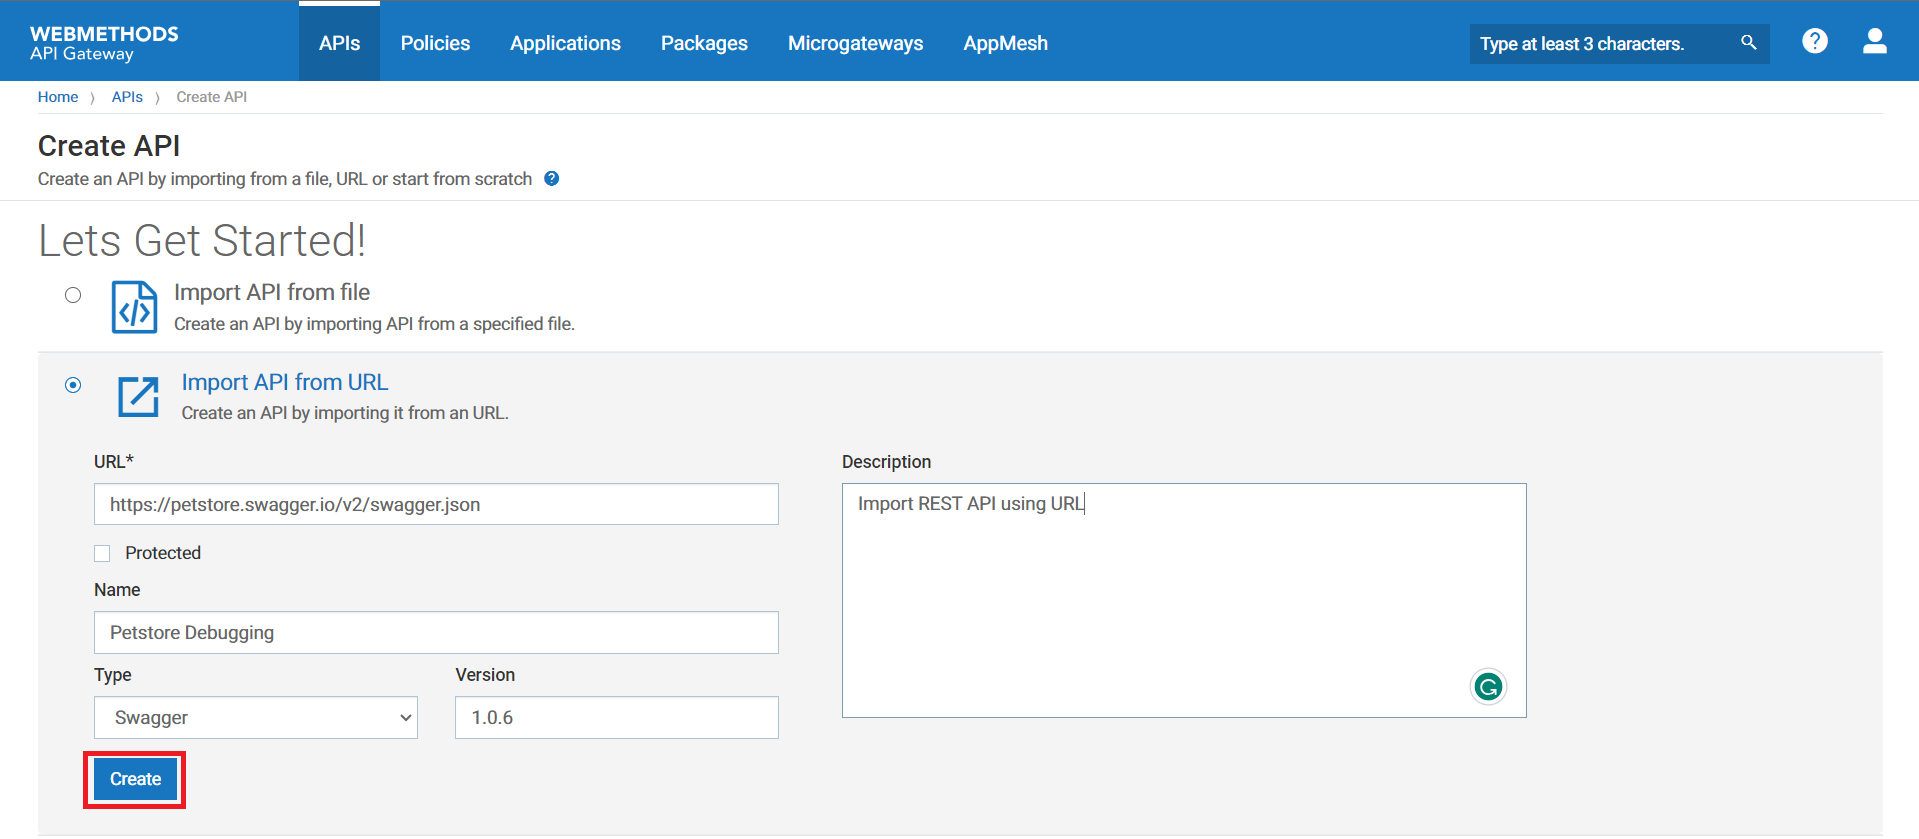
Create APIClick
Import API from URLProvide the following information:
Name: Petstore Debugging
Version: 1.0.6
Description: Import REST API using URL
Type: Swagger
2. Click on the Activate button to activate API.
The API details page displays the Basic information, Technical information, Resources, methods, and selected API specifications.
3. Click Enable tracing.
When you enable tracer, API Gateway captures a large amount of data, which might impact the performance and availability of the product. Hence Software AG strongly recommends you disable the tracer when not needed.
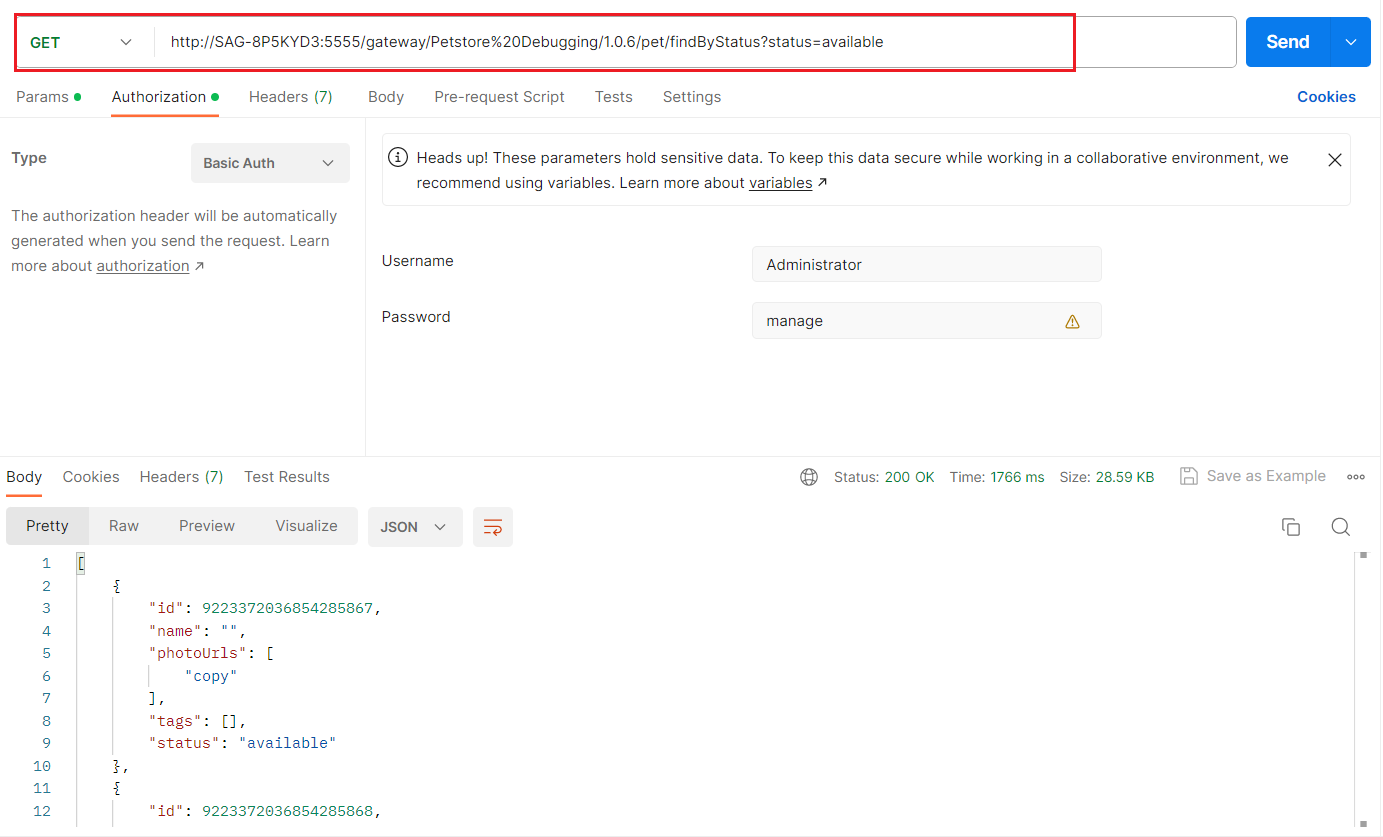
4. Now you can invoke REST API URI in Postman. To know how to invoke API using Postman follow the below steps:
Open
Postman and create a new request.
Click the
Send button to invoke the endpoint .
After the API is successfully invoked, a success message appears, allowing you to access the details in the Tracer tab.
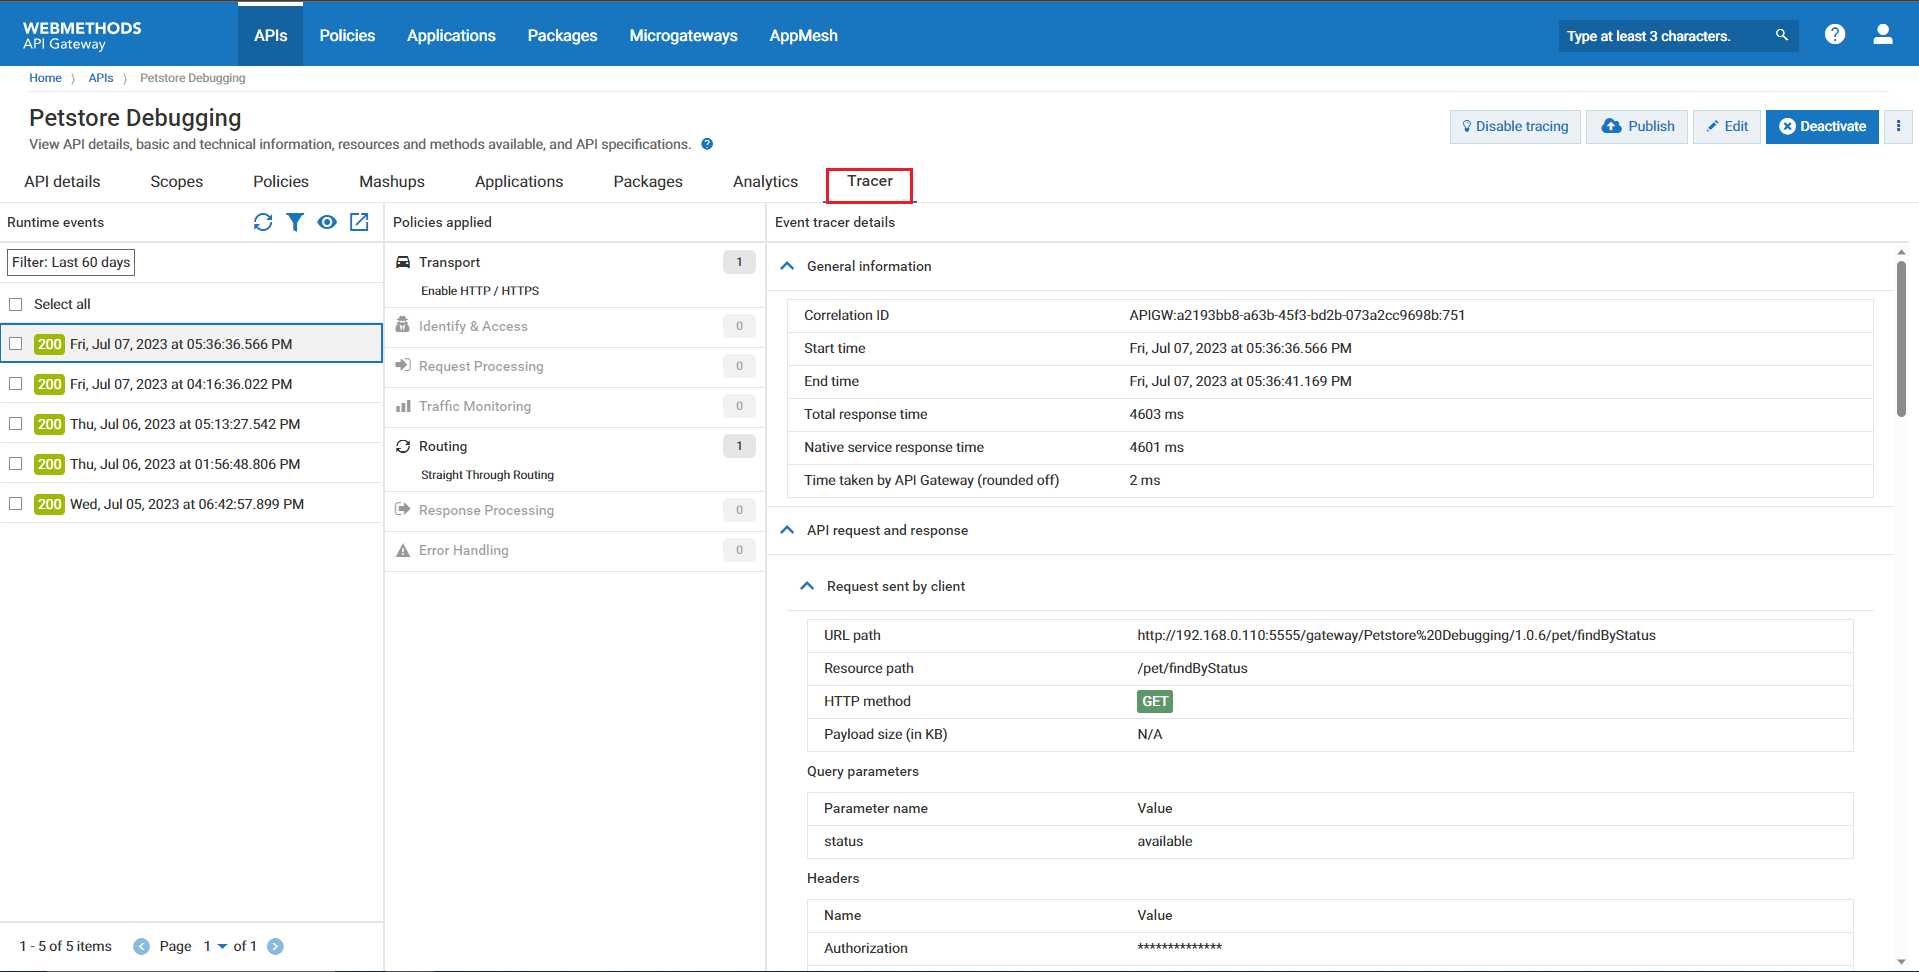
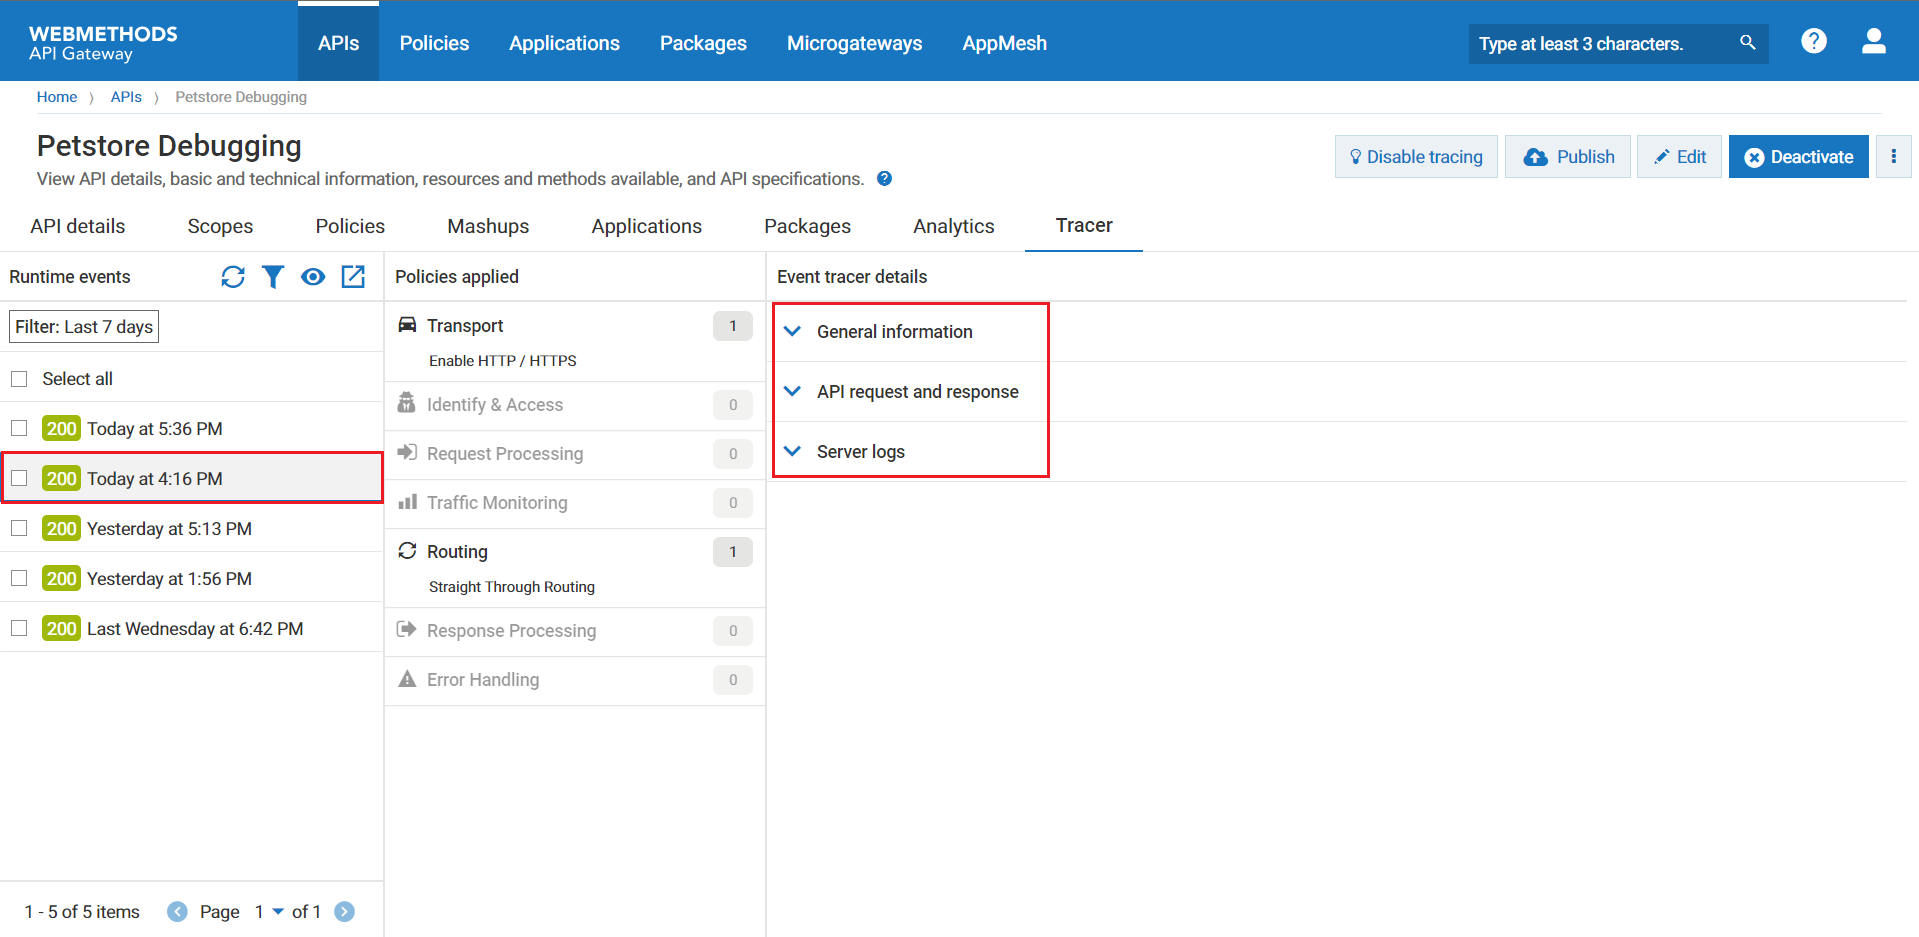
5. Click the Tracertab to view the trace details of Petstore Debugging.
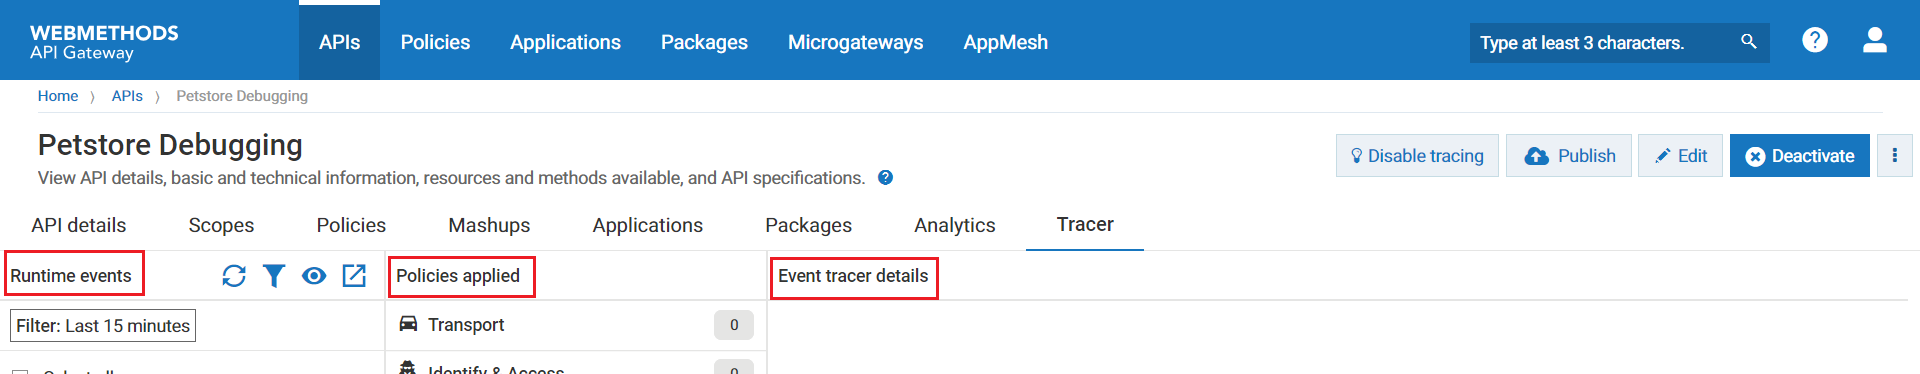
6. The Trace API page displays the Runtime events, Policies applied, and Event tracer details sections.
Note:
The Runtime events section lists only 20 runtime events per page. When you click the Select all per page check box, all the runtime events of the API do not get selected. Instead, the 20 runtime events listed on that page get selected.
The Runtime events section displays the list of runtime events. When you click Runtime event by default it refreshes the Policies applied and Event tracer details sections. Event tracer details display General Information, API request and response, and Server logs sections. In the Policies applied section, click the stage name for which you want to view the trace details.
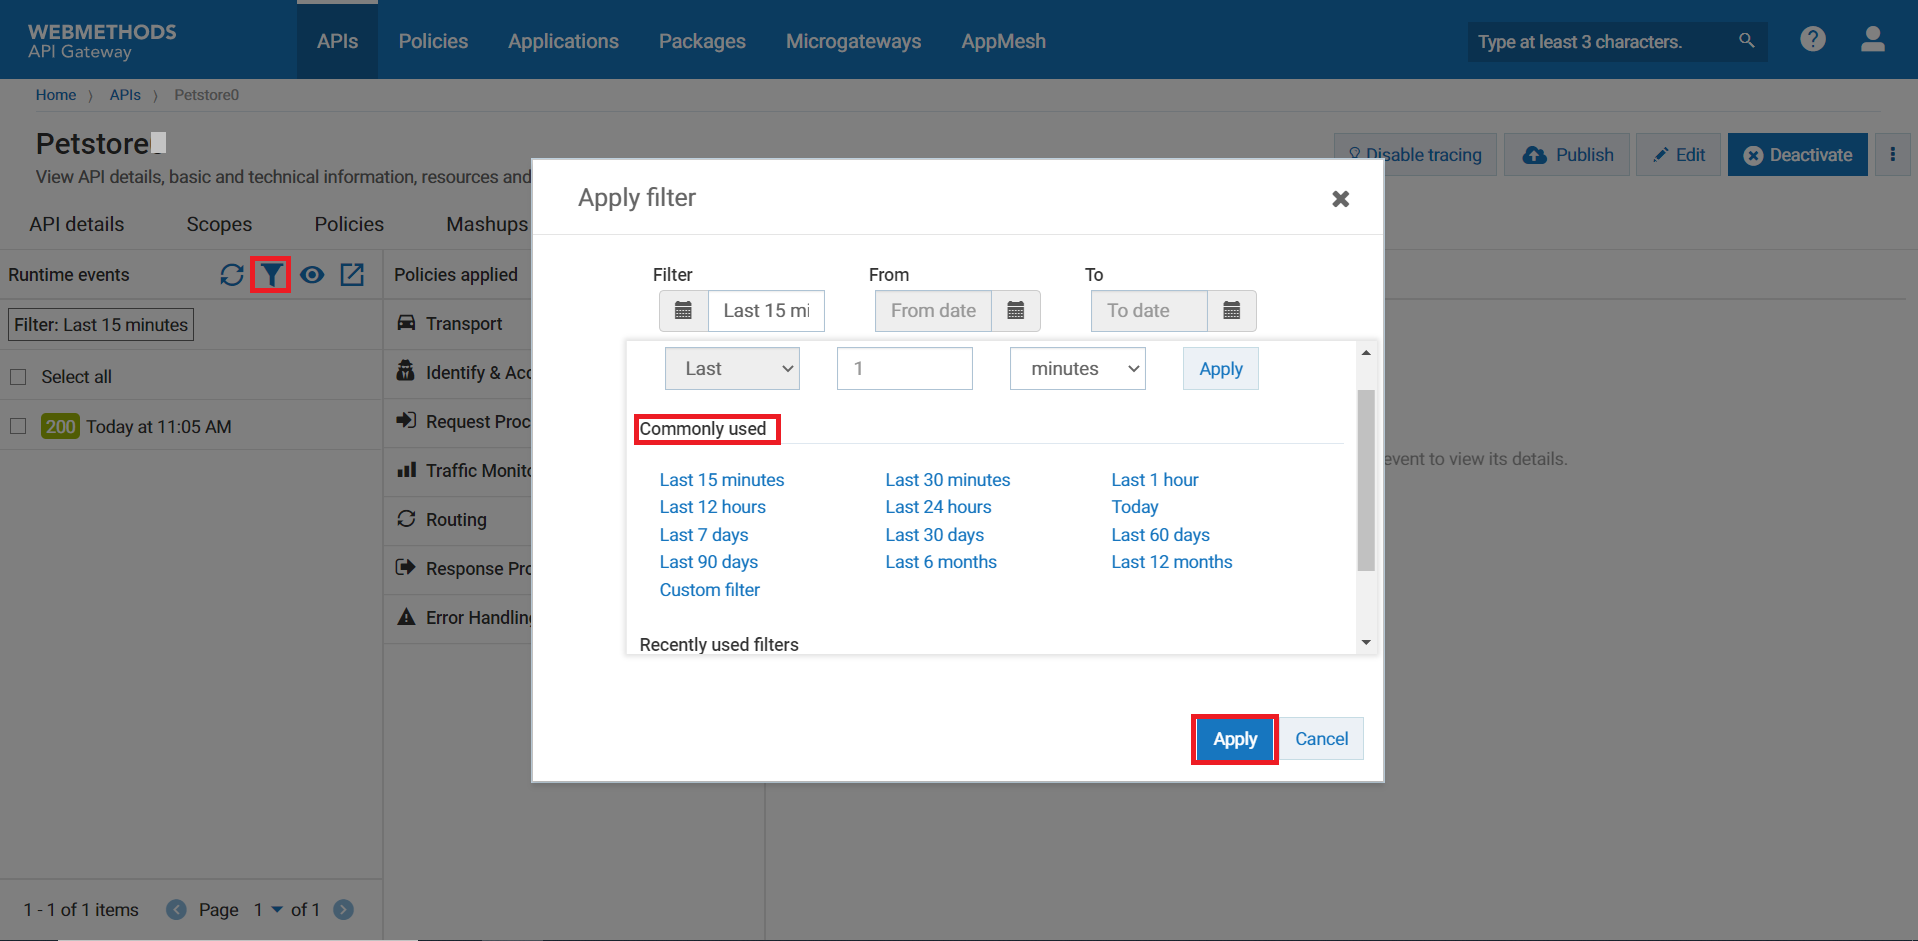
7. In the Runtime events section, you can find Refresh, Filter, Import and View events, and Exportoptions. 
a. Filter
: To filter the runtime events, click
and select the time interval using
Quick select and
Commonly used filters. The
Runtime events section displays the list of runtime events based on the applied filter.

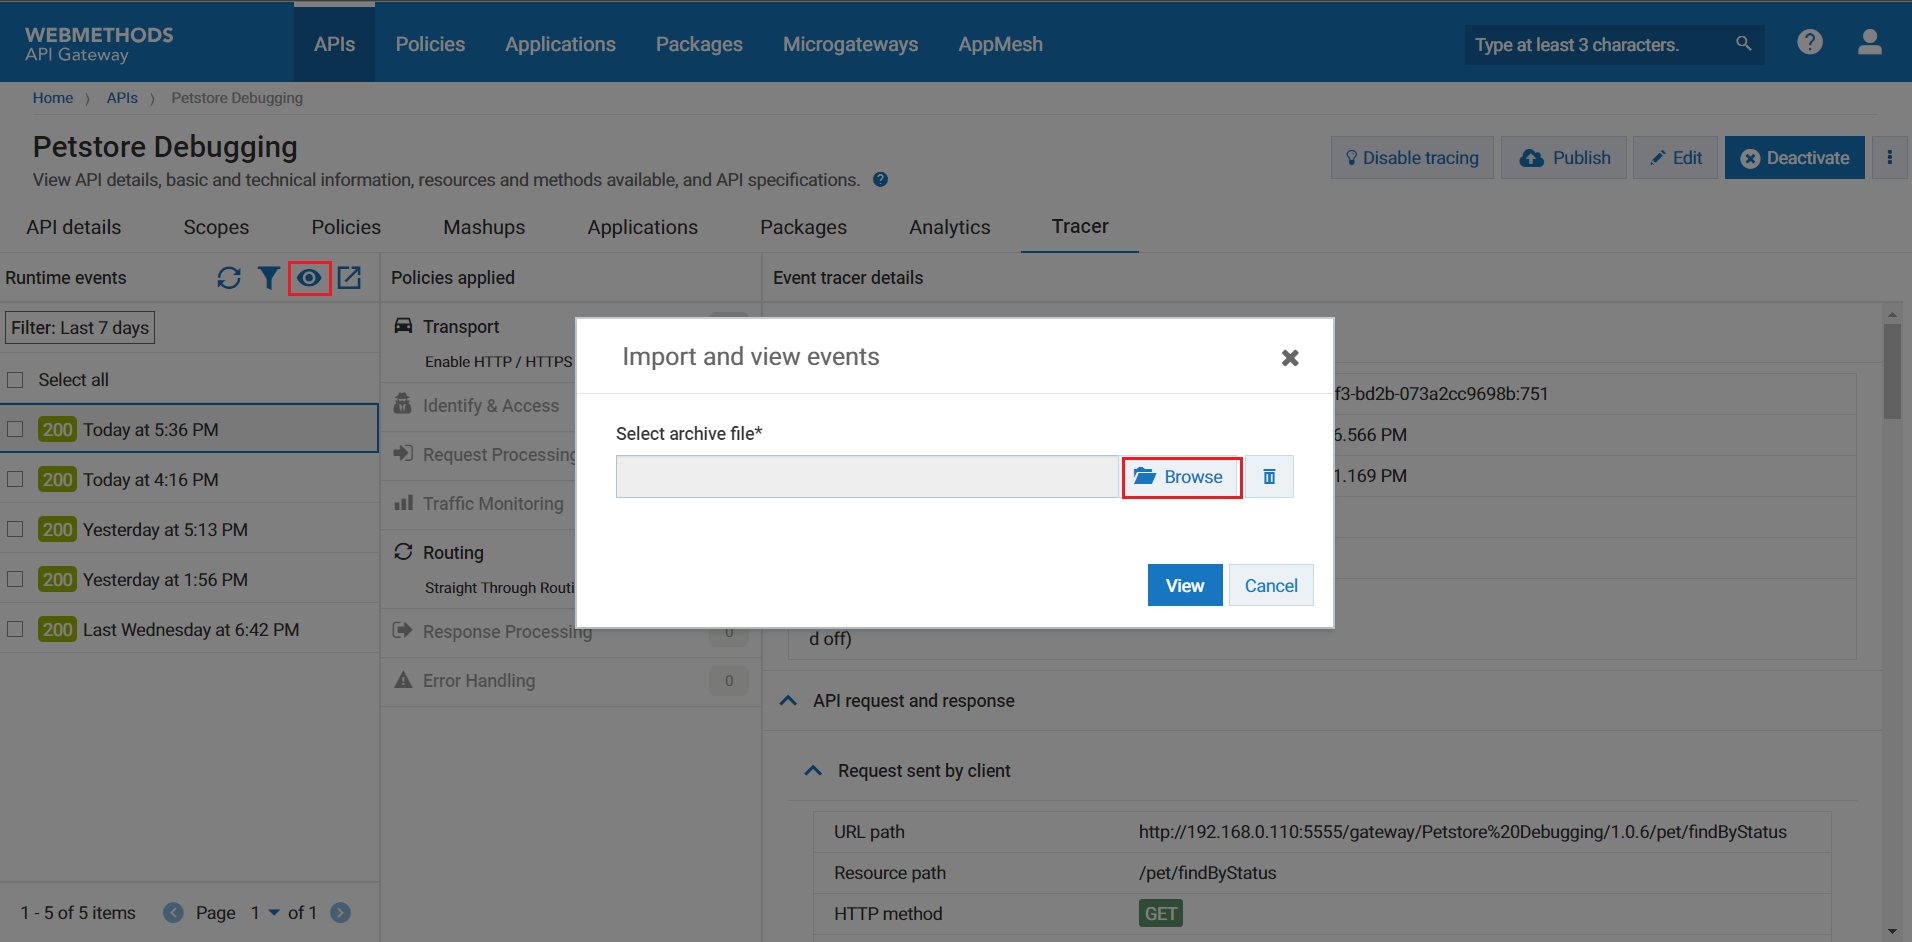
b. Import and View events: In the
Runtime events section, Click

to import the archived runtime requests. The
Import and view events pop-up window displays. Browse the runtime requests file that you want to import and
View.
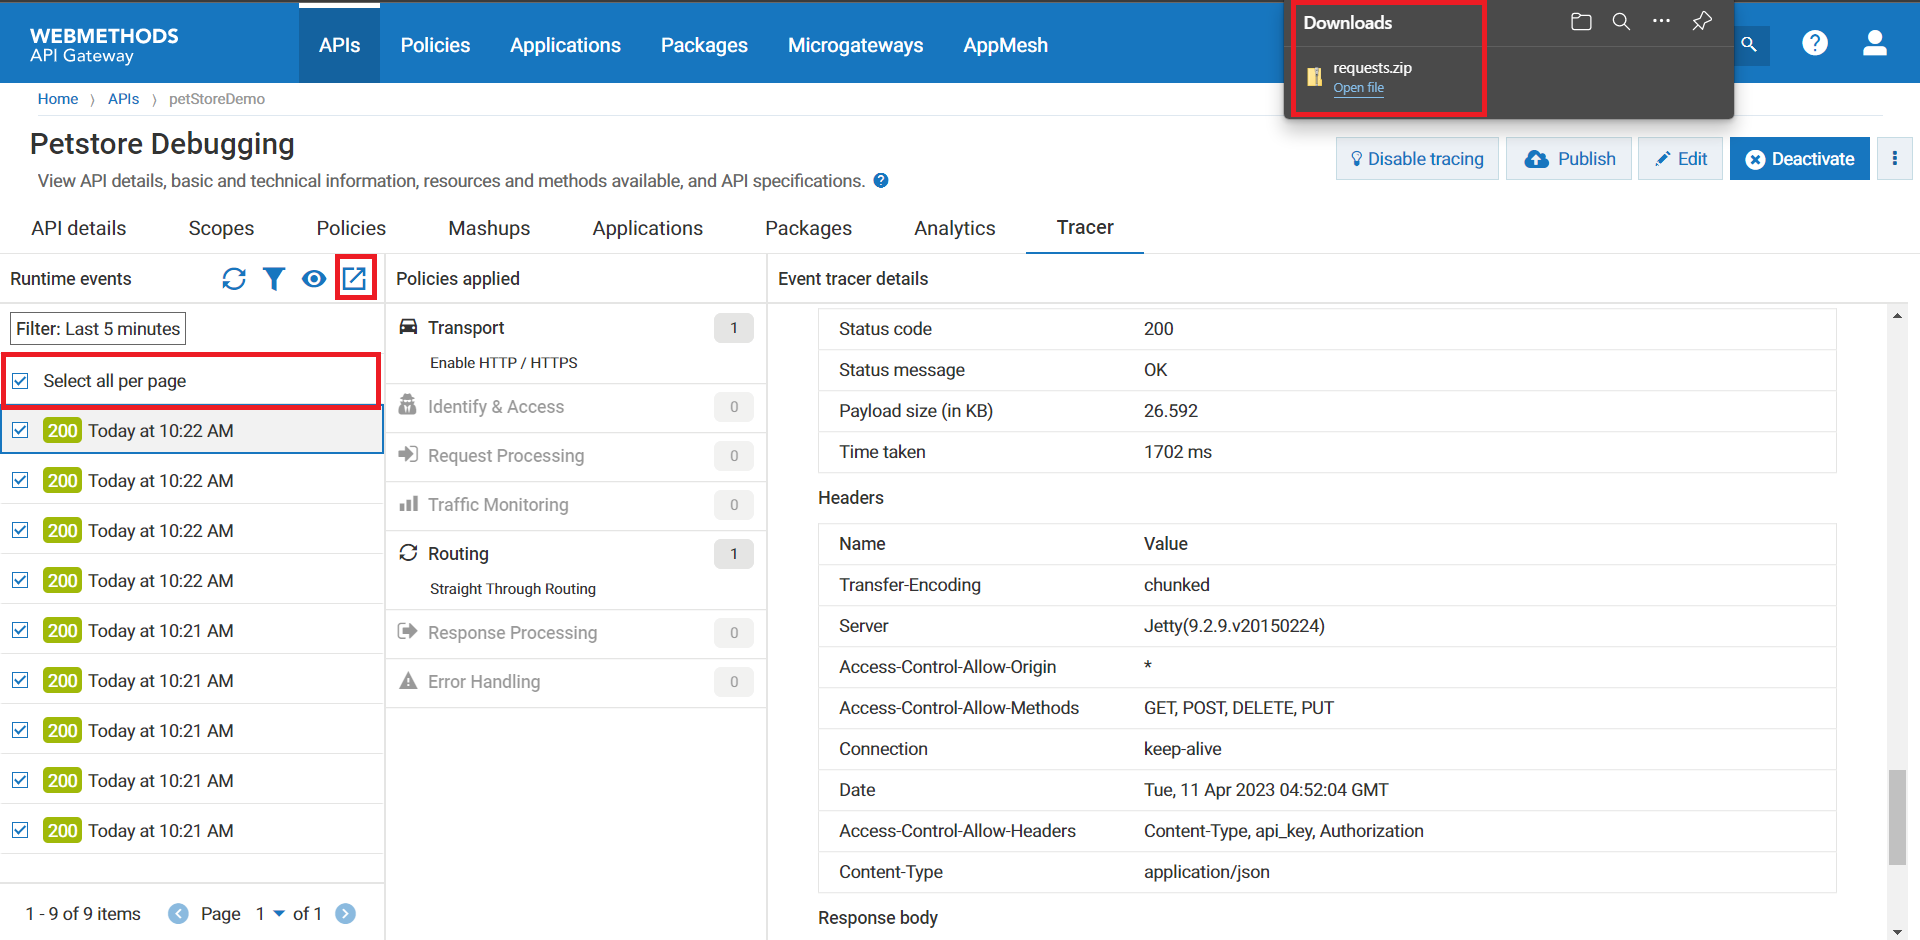
c. Export: In the
Runtime events section, select the runtime event that you want to export or download. Click

to export the runtime request.