Monitor your API
Understanding the usage and performance of your APIs is crucial for enhancing their functionality, diagnosing issues, and making informed business decisions. Addressing the following queries contributes to API improvements and informed decision-making.

How are your APIs performing over time?
Which APIs are frequently utilized or under-utilized?
When is API response time optimal?
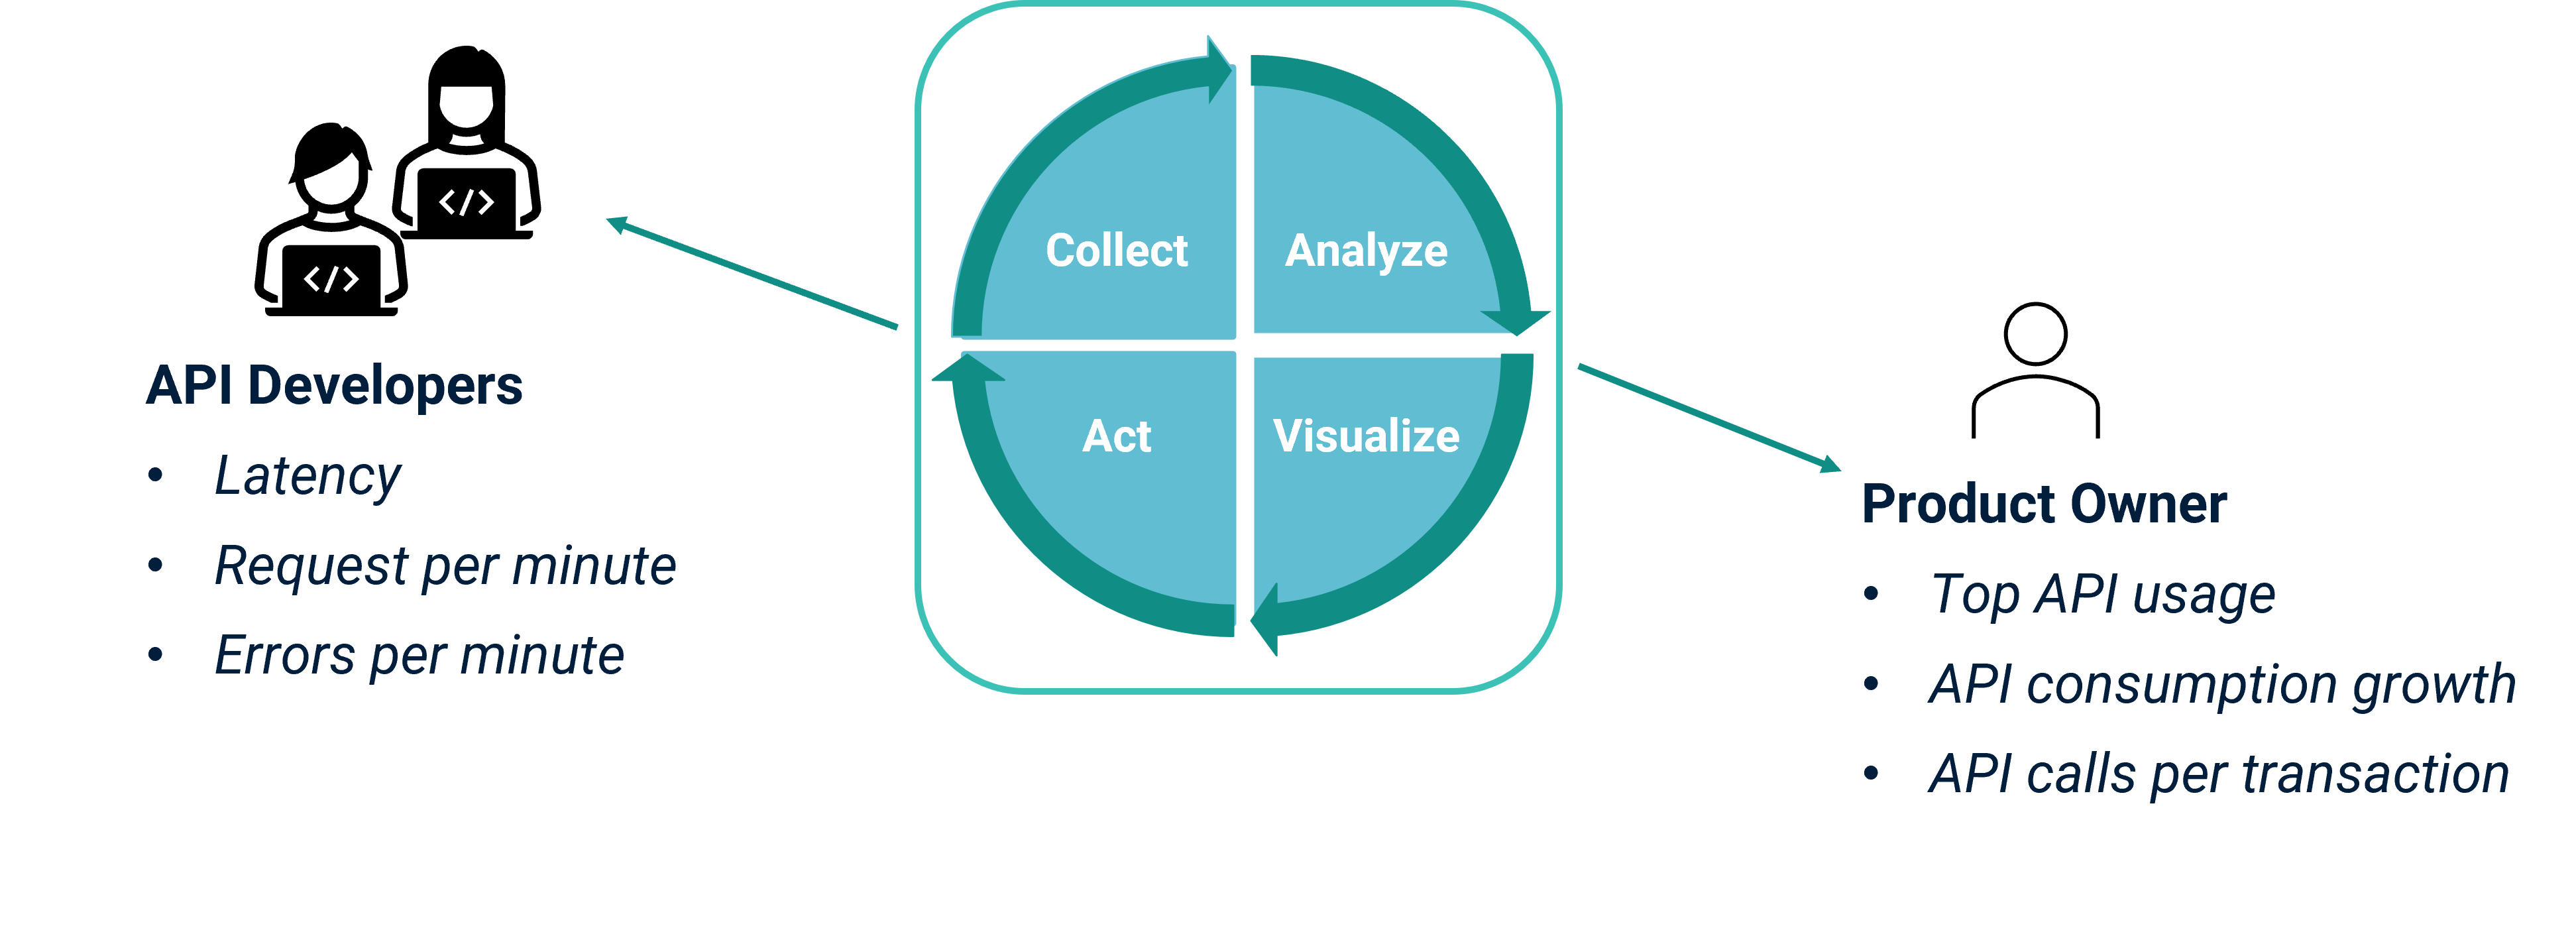
API Gateway offers comprehensive monitoring capabilities to address these challenges. It collects and analyses data concerning the availability and performance of both the API Gateway and the APIs themselves. This proactive approach enables the swift identification of issues that could potentially impact users (API developers and product owners).
The analytics dashboard in the API Gateway UI displays a variety of charts to provide an overview of API Gateway performance and its API usage. The dashboard has various filters that you can apply depending on what you want to monitor.
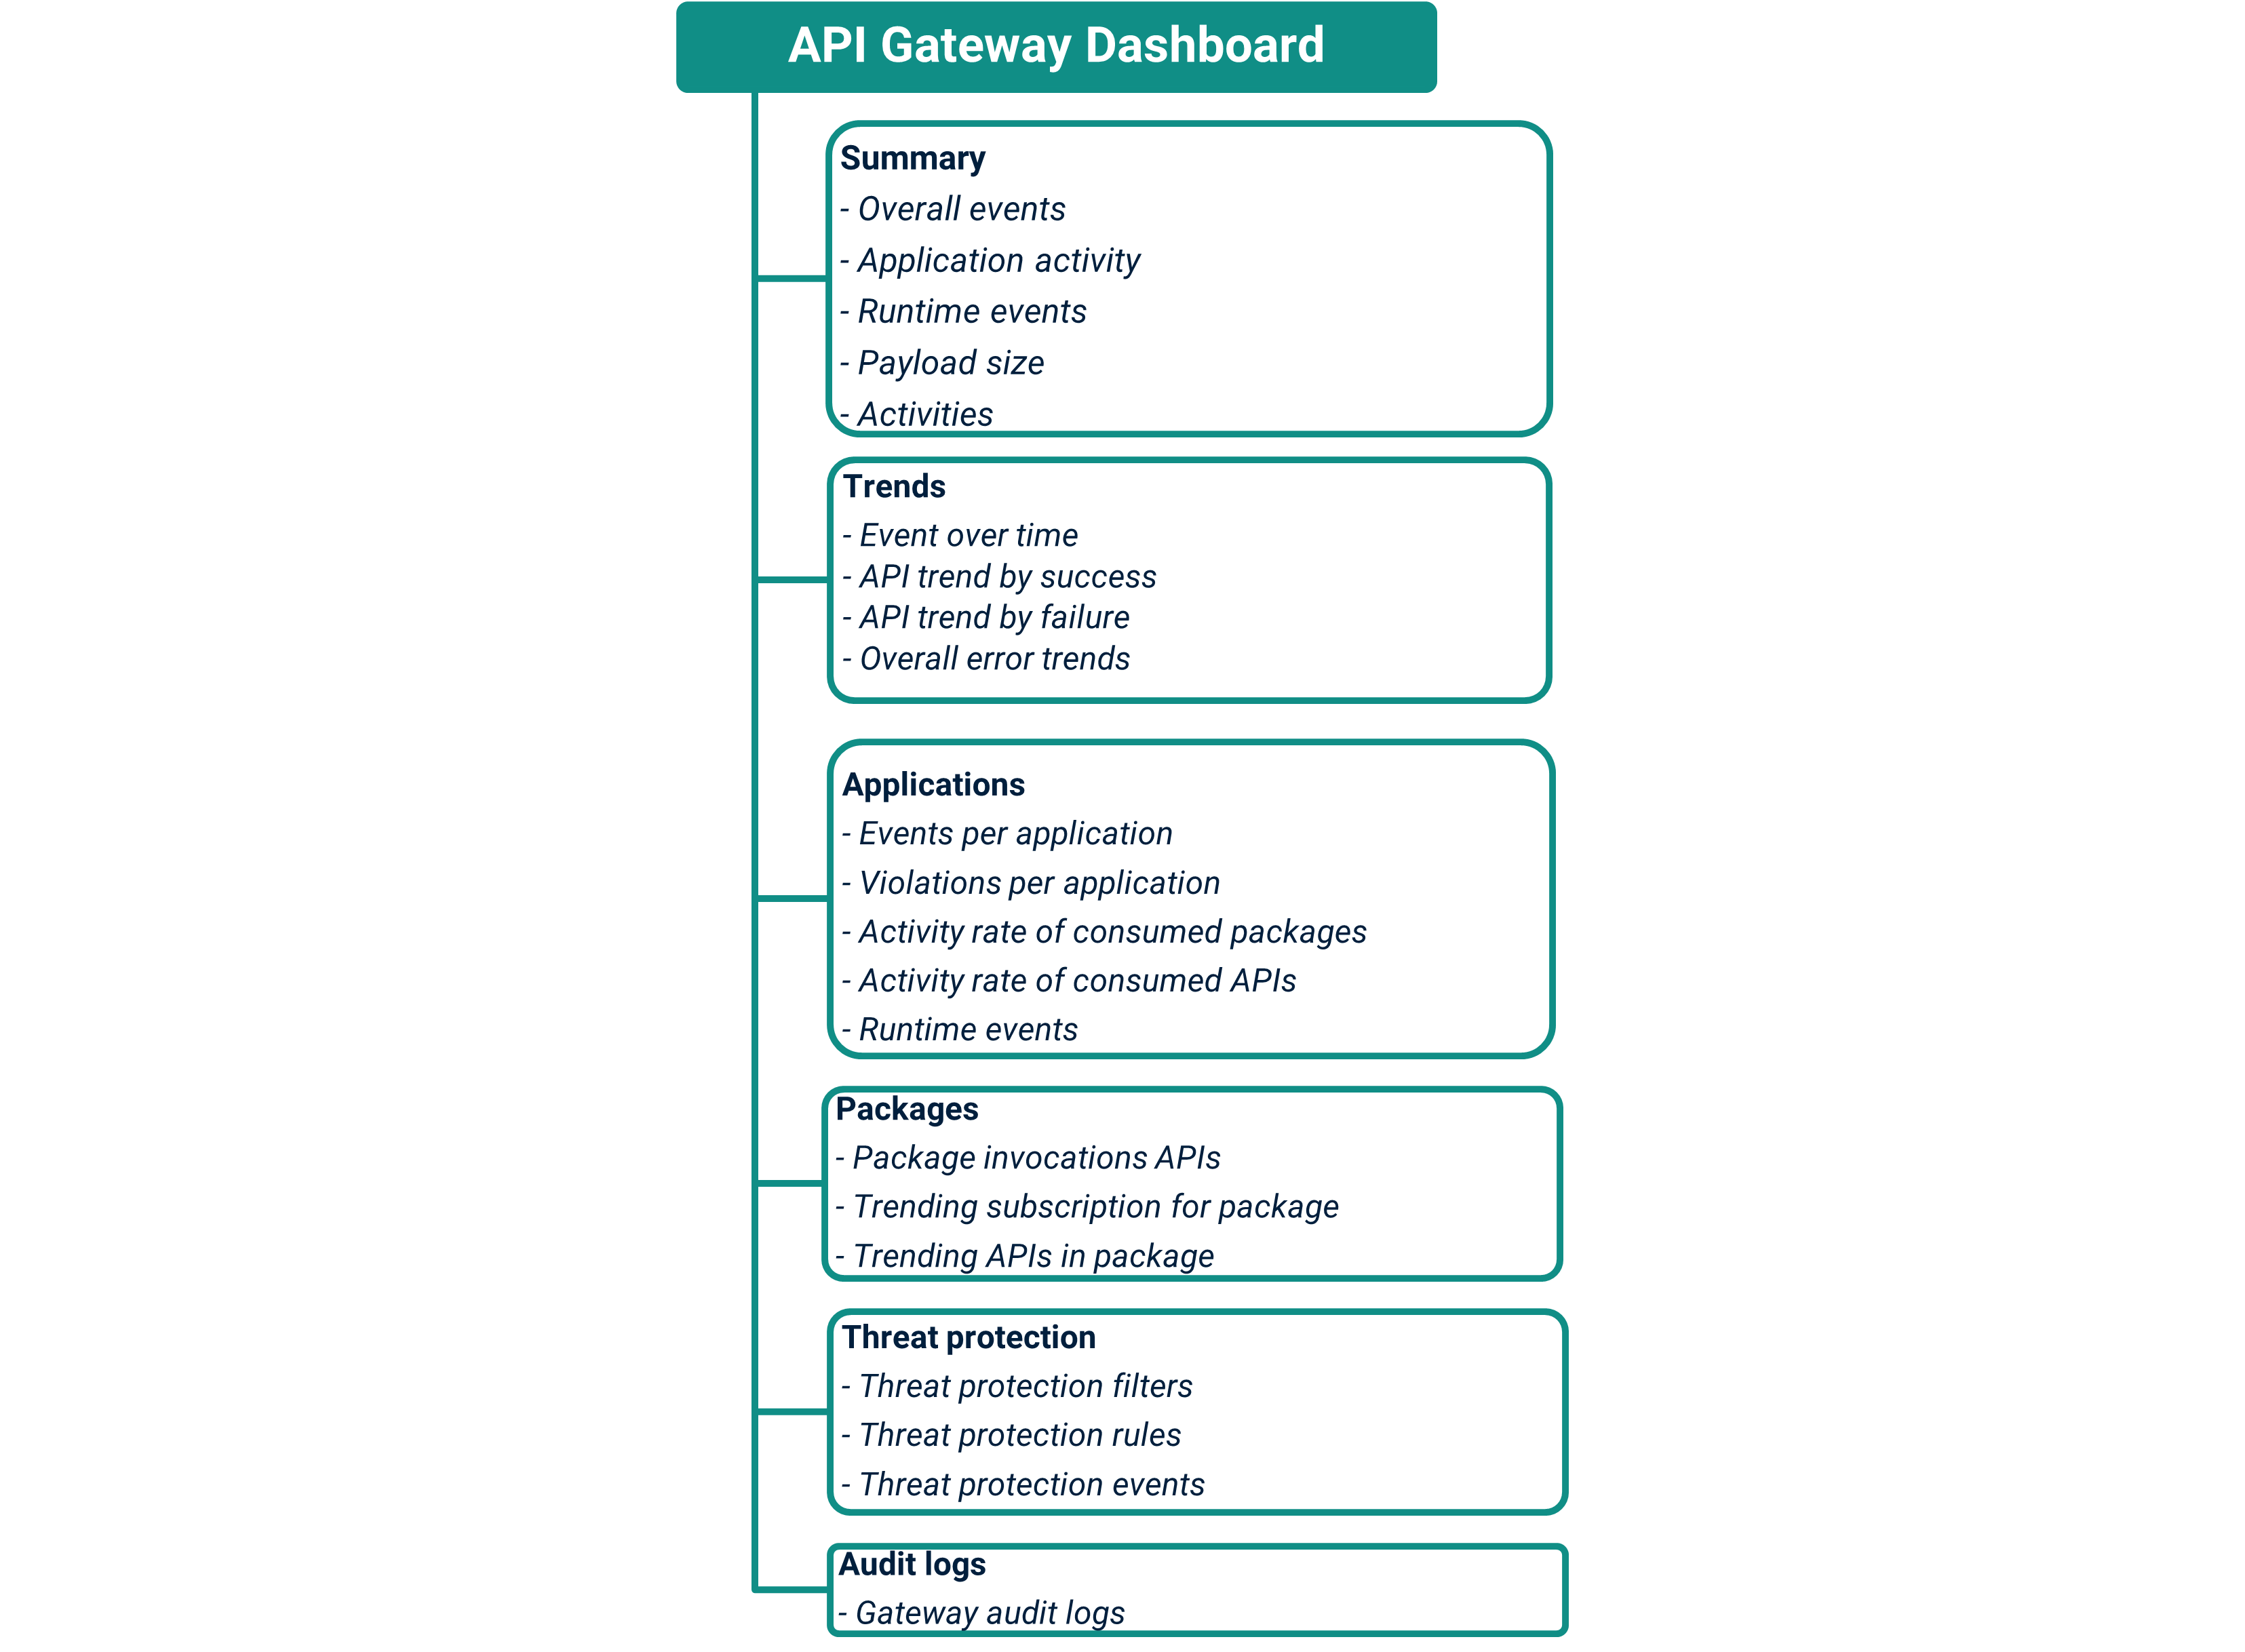
API Gateway dashboard
Displays API Gateway-wide analytics. The following graphic explains the information that you can view in various widgets in the API Gateway dashboard. You can use this information depending on what you want to monitor:
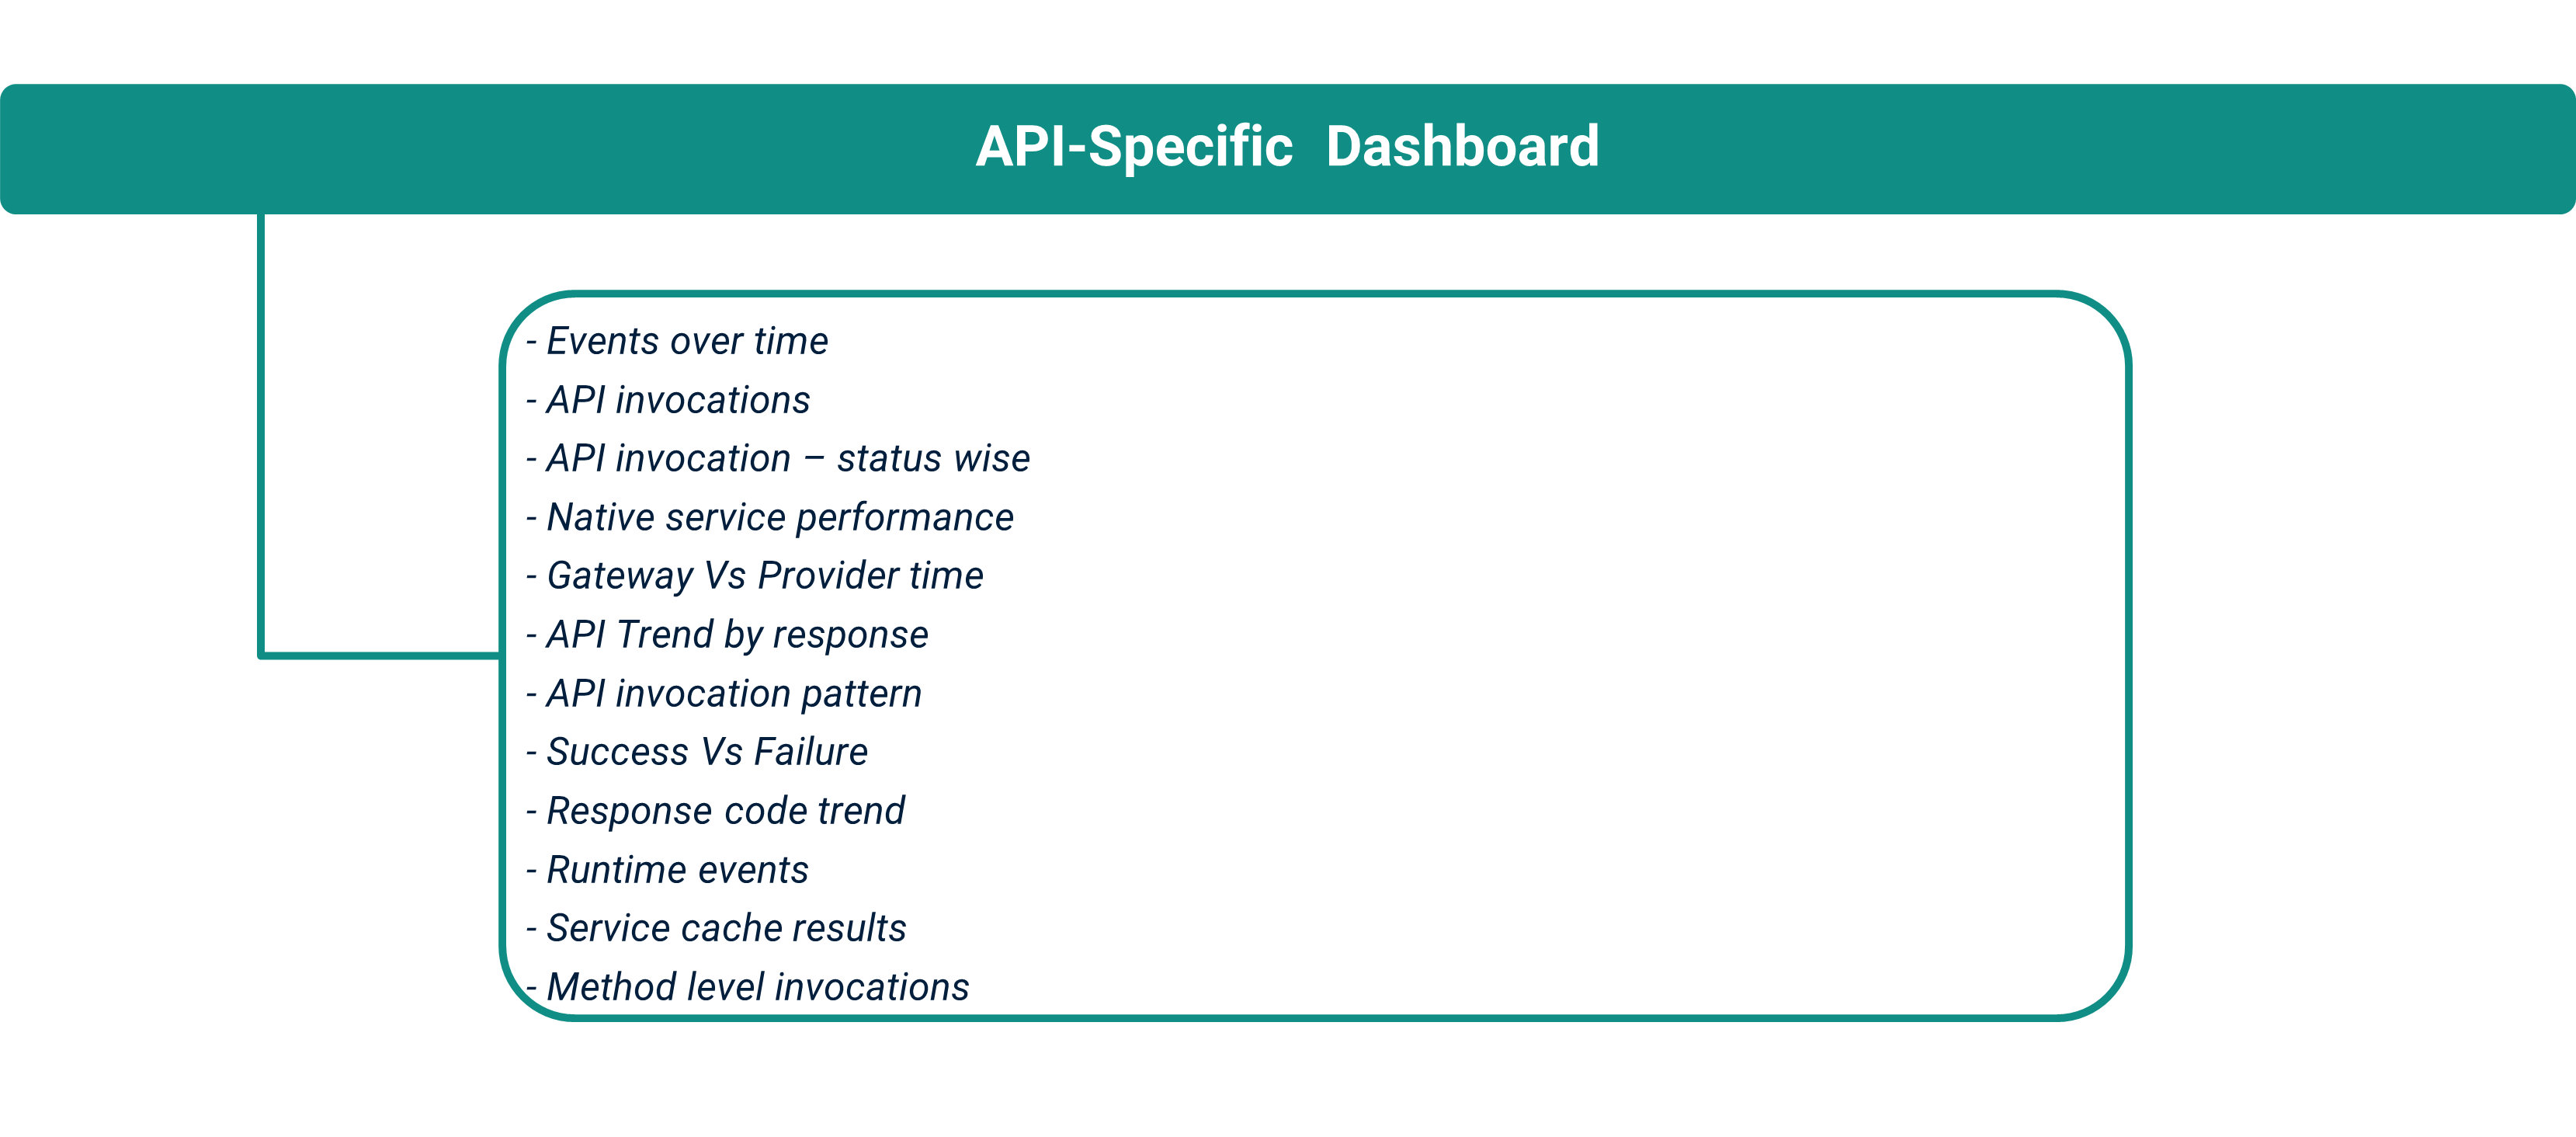
API-specific dashboard
Displays API-specic analytics. The following graphic explains the information that you can view in various widgets in the API-specific dashboard. You can use this information depending on what you want to monitor:
Before you begin
Ensure that you have
Manage APIs or Activate / Deactivate APIs functional privilege. If you are an Administrator you would have this privilege
Postman installed in your system, or you can you use the web version of Postman
How to monitor API-specific analytics?
Let's look at an example, where you secure REST APIs, Petstore_V1 and Petstore_V2, with an API key and enforce Log Invocation policy so that you can monitor the total number of invocation and its success and failure invocation from it's API-specific dashboards.

To view API-specific analytics
1. Create a REST API Petstore_V1.
a. Click APIs in the title navigation bar.
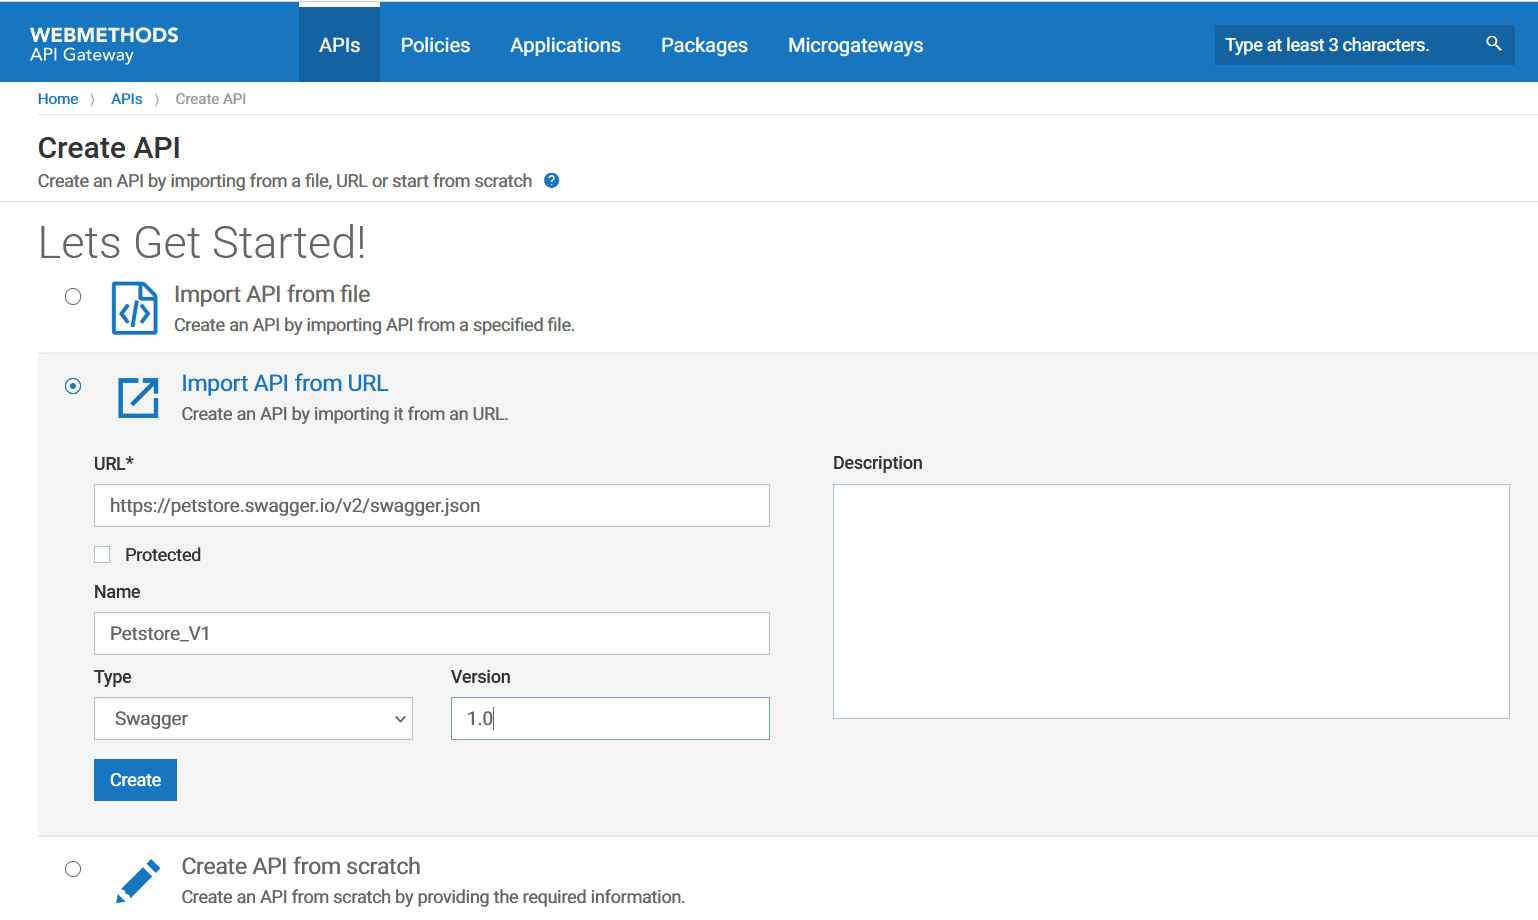
b. Click Create API.
c. Select Import API from URL.
d. Provide the following information:
Name: Petstore_V1
Version: 1.0
e. Click Create.
The Petstore_V1 API is created and the API's details page appears.
f. Click Activate to activate the API.
2. Enforce the API with the Identify and Access policy to configure the identification type as API Key.
a. Click Edit.
b. Click the Policies tab.
c. Click Identify & Access in the policy catalog section.
d. Click + next to Identify & Authorize to add the policy.
e. Provide the following information in the policy properties section:
Condition type:
OR Identification type:
API Key Application lookup condition:
Registered applications f. Click Traffic Monitoring in the policy catalog section.
g. Click + next to Log Invocation to add the policy.
h. Select the following in the policy properties section:
Store Request Headers Store Request Payload Store Response Headers Store Response Payload API Gateway i. Click Save. The API is now enforced with the required policy.
3. Create an application api_consumer1 and api_consumer2 and associate the Petstore_V1 API to the application. Adding the API to the application enables the application to access the API. An API developer while invoking the API at runtime, must provide the API key for API Gateway to identify the application.
a. Click Applications in the title navigation bar.
b. Click Create application.
c. Provide the following information:
Name:
api_consumer1 Version:
1.0 d. Click Continue to Identifiers >
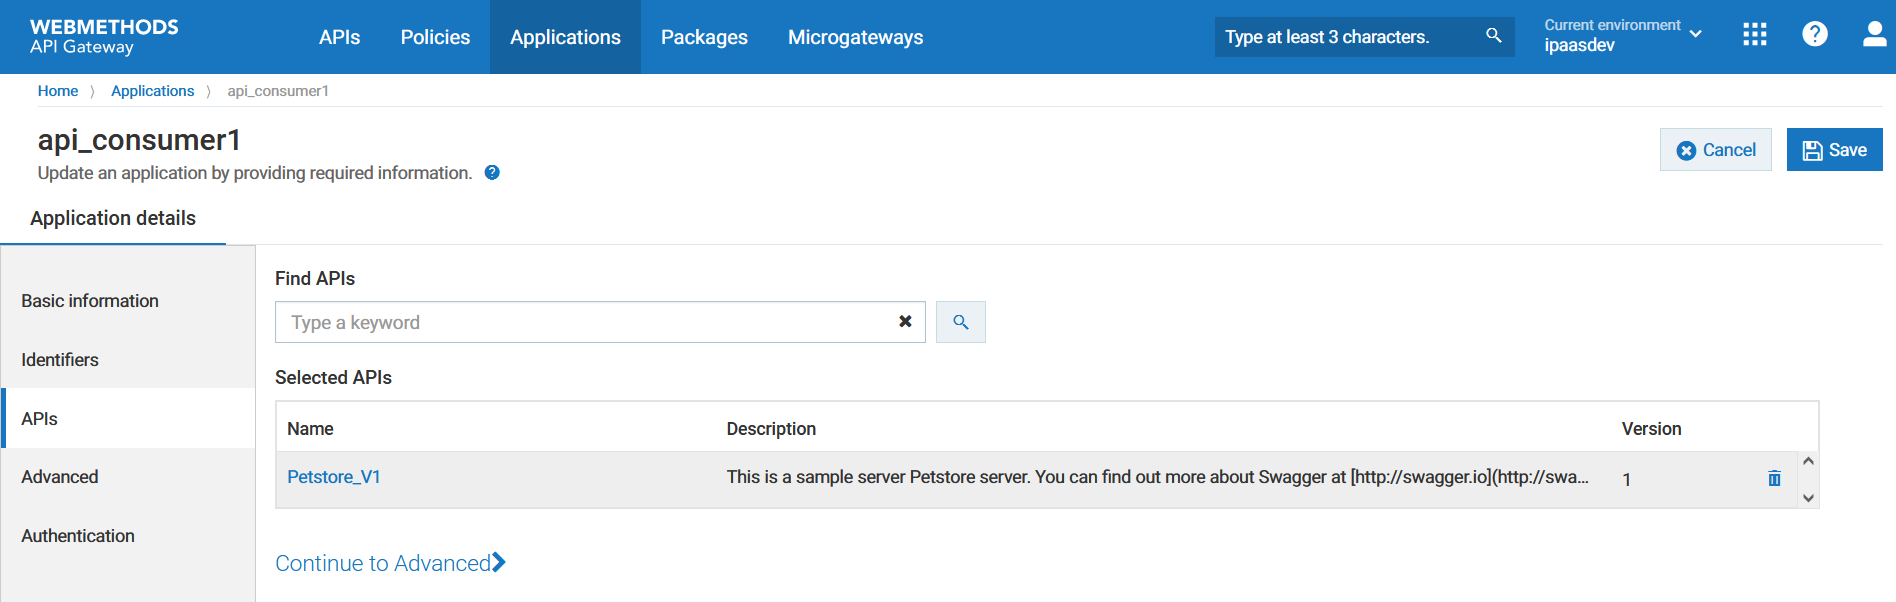
e. Click Continue to APIs >
f. Type the keyword Petstore in the search box to find the API Petstore_V1 and click + to add the API.
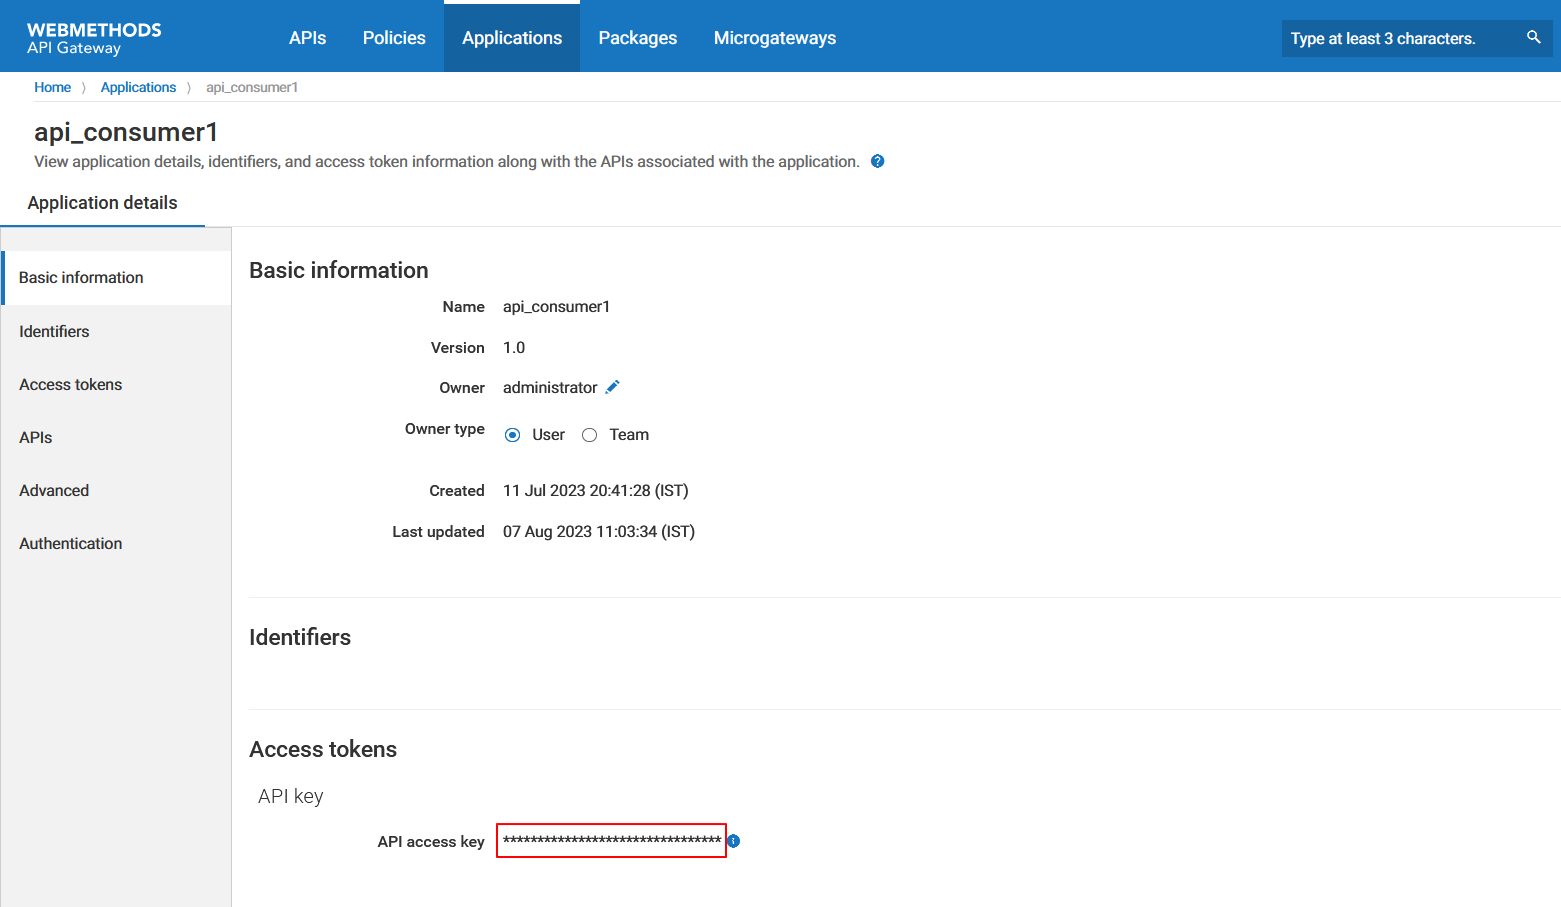
g. Click Save. The application is now saved and the application details page appears.
Note:
Similary, create another application named api_consumer2 and associate to the API Petstore_V1.
4. Make a note of the API key to use to access the API.
5. Authenticate and access the petstore API using the API key.
In this example, we use the Postman application to invoke and access the API.
a. Open Postman.
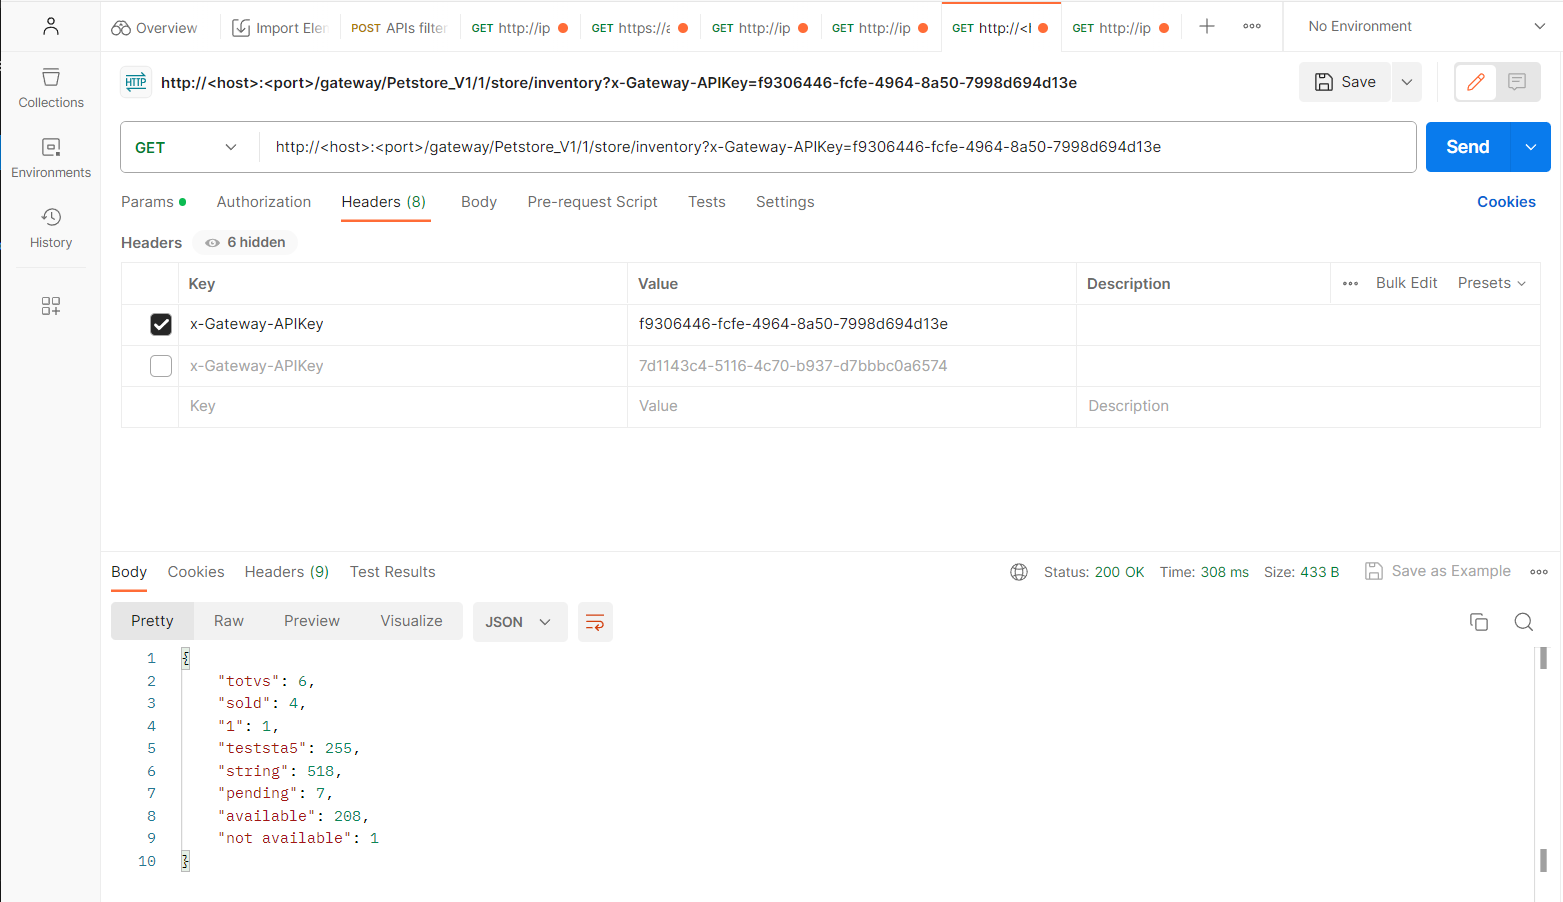
b. In the Postman UI, select the http method as GET to retrieve the details of the pets by status.
c. Invoke the endpoint, http://host:port/gateway/Petstore_V1/1.0/pet/store/inventory
d. In the Header tab, provide the following information:
Key:
x-Gateway-APIKey Value: The API key of the application
api_consumer1 Key:
x-Gateway-APIKey Value: The API key of the application
api_consumer2 e. Select any one of the API key.
f. Click Send. The REST API is invoked successfully and returns the status code as 200. The response contains the requested inventory data.
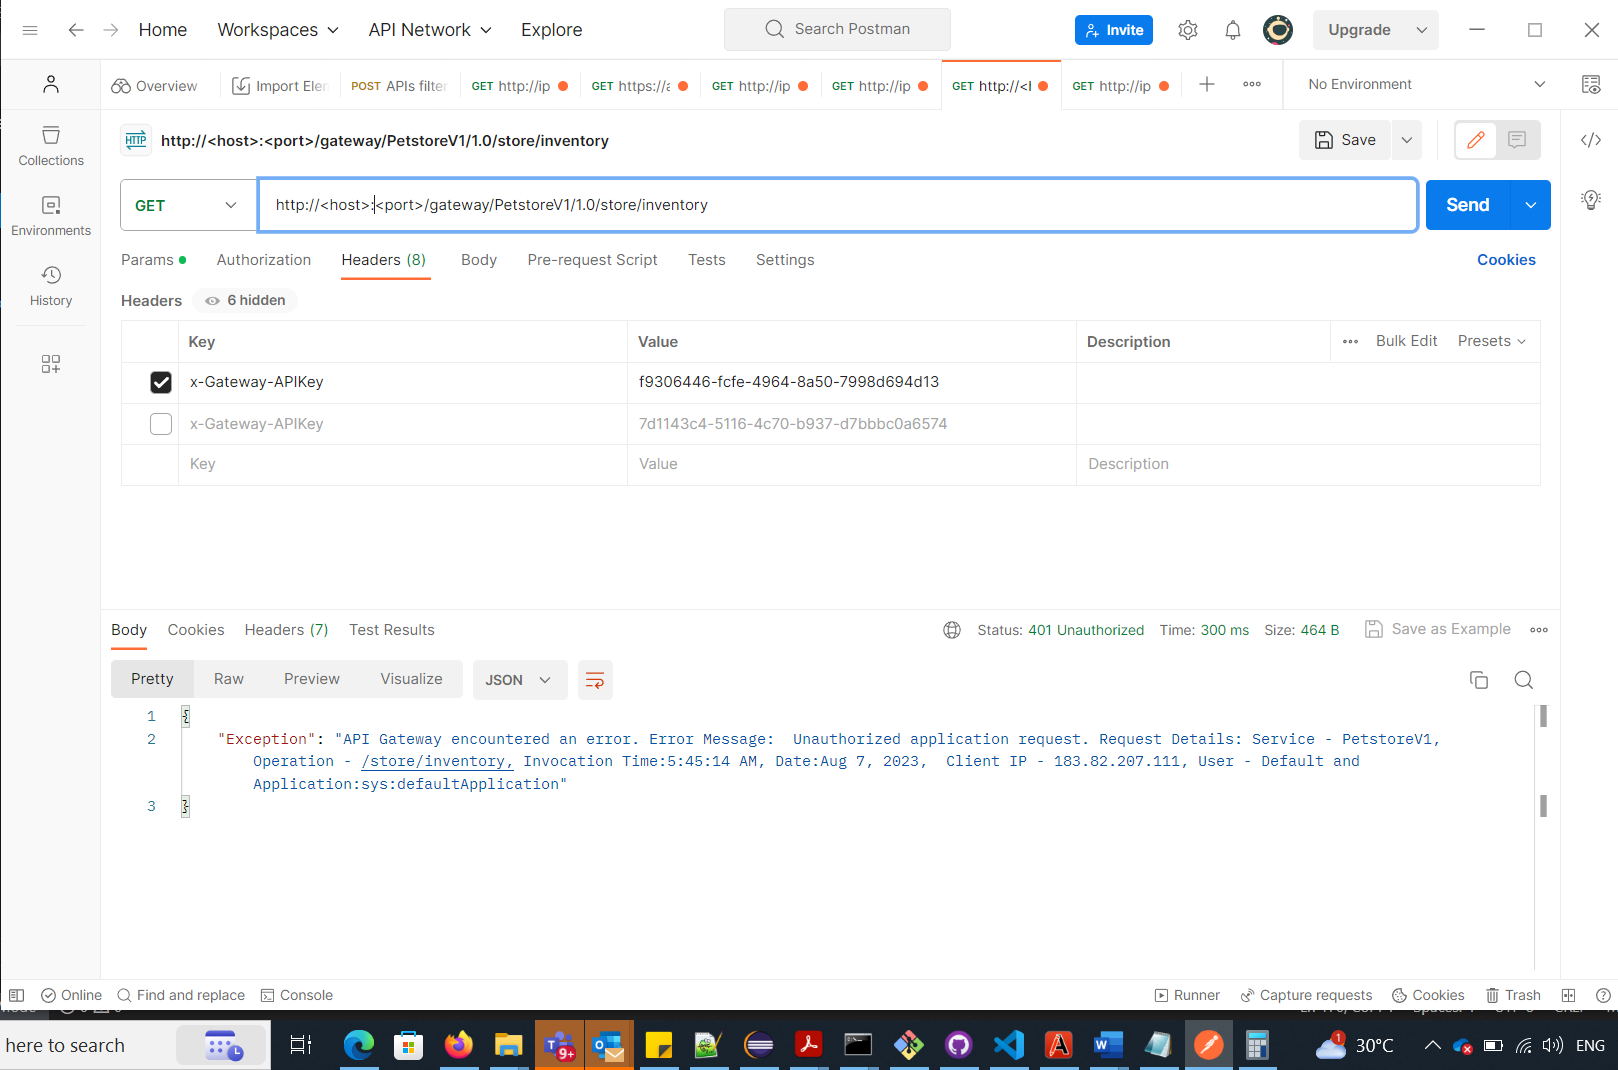
In case the API key is invalid, you should see an error accessing the API as follows with the status code 401.
6. Monitor API-specific analytics.
a. Click APIs in the title navigation bar.
b. Click the API Petstore_V1.
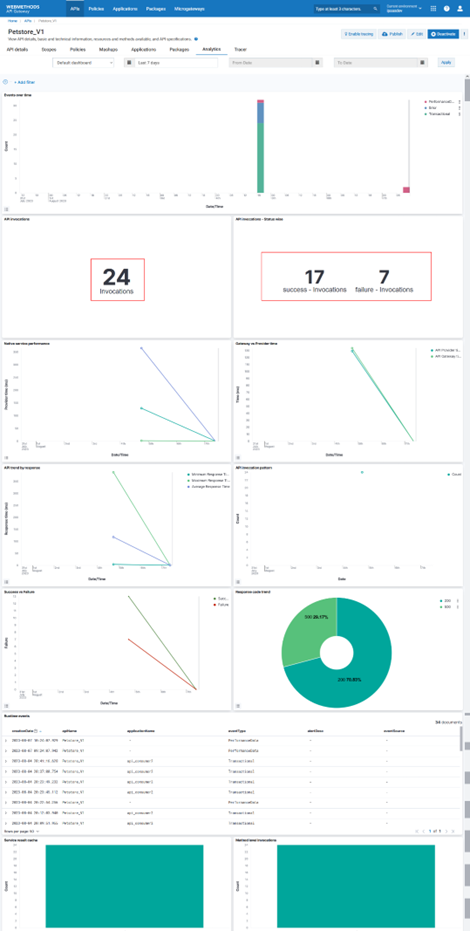
c. Click Analytics to view the analytics of the API.
The API Invocation widget displays the total invocation count and API invocation - Status wise widget displays the successful invocation count and failure invocation count.The Response Code Trend widget displays the trend chart based on the response code of the API Petstore_V1.
Note:
Similarly follow the same steps and create another API named *Petstore_V2 and monitor its API-specific analytics.
How to monitor API Gateway-wide analytics?
Let's look at an example, where you filter the REST APIs, Petstore_V1 and Petstore_V2 and monitor the total number of invocation and its success and failure invocation from the API Gateway-wide dashboard.
To view API Gateway-wide analytics
1. Click User menu in the title navigation bar and select Analytics.
The API Gateway-wide dashboard appears displaying all the analytics of all the APIs.
2. Select the period for which you want to view the analytics.
3. Click + Add Filter and provide the following information:
Field:
apiName Operator:
is one of Values:
petstore_v1, petstore_v2 4. Click Save. The API Gateway-wide dashboard appears displaying the analytics pertaining to the APIs Petstore_V1 and Petstore_V2.
5. Click + Add Filter and provide the following information:
Field:
applicationName Operator:
is one of Values:
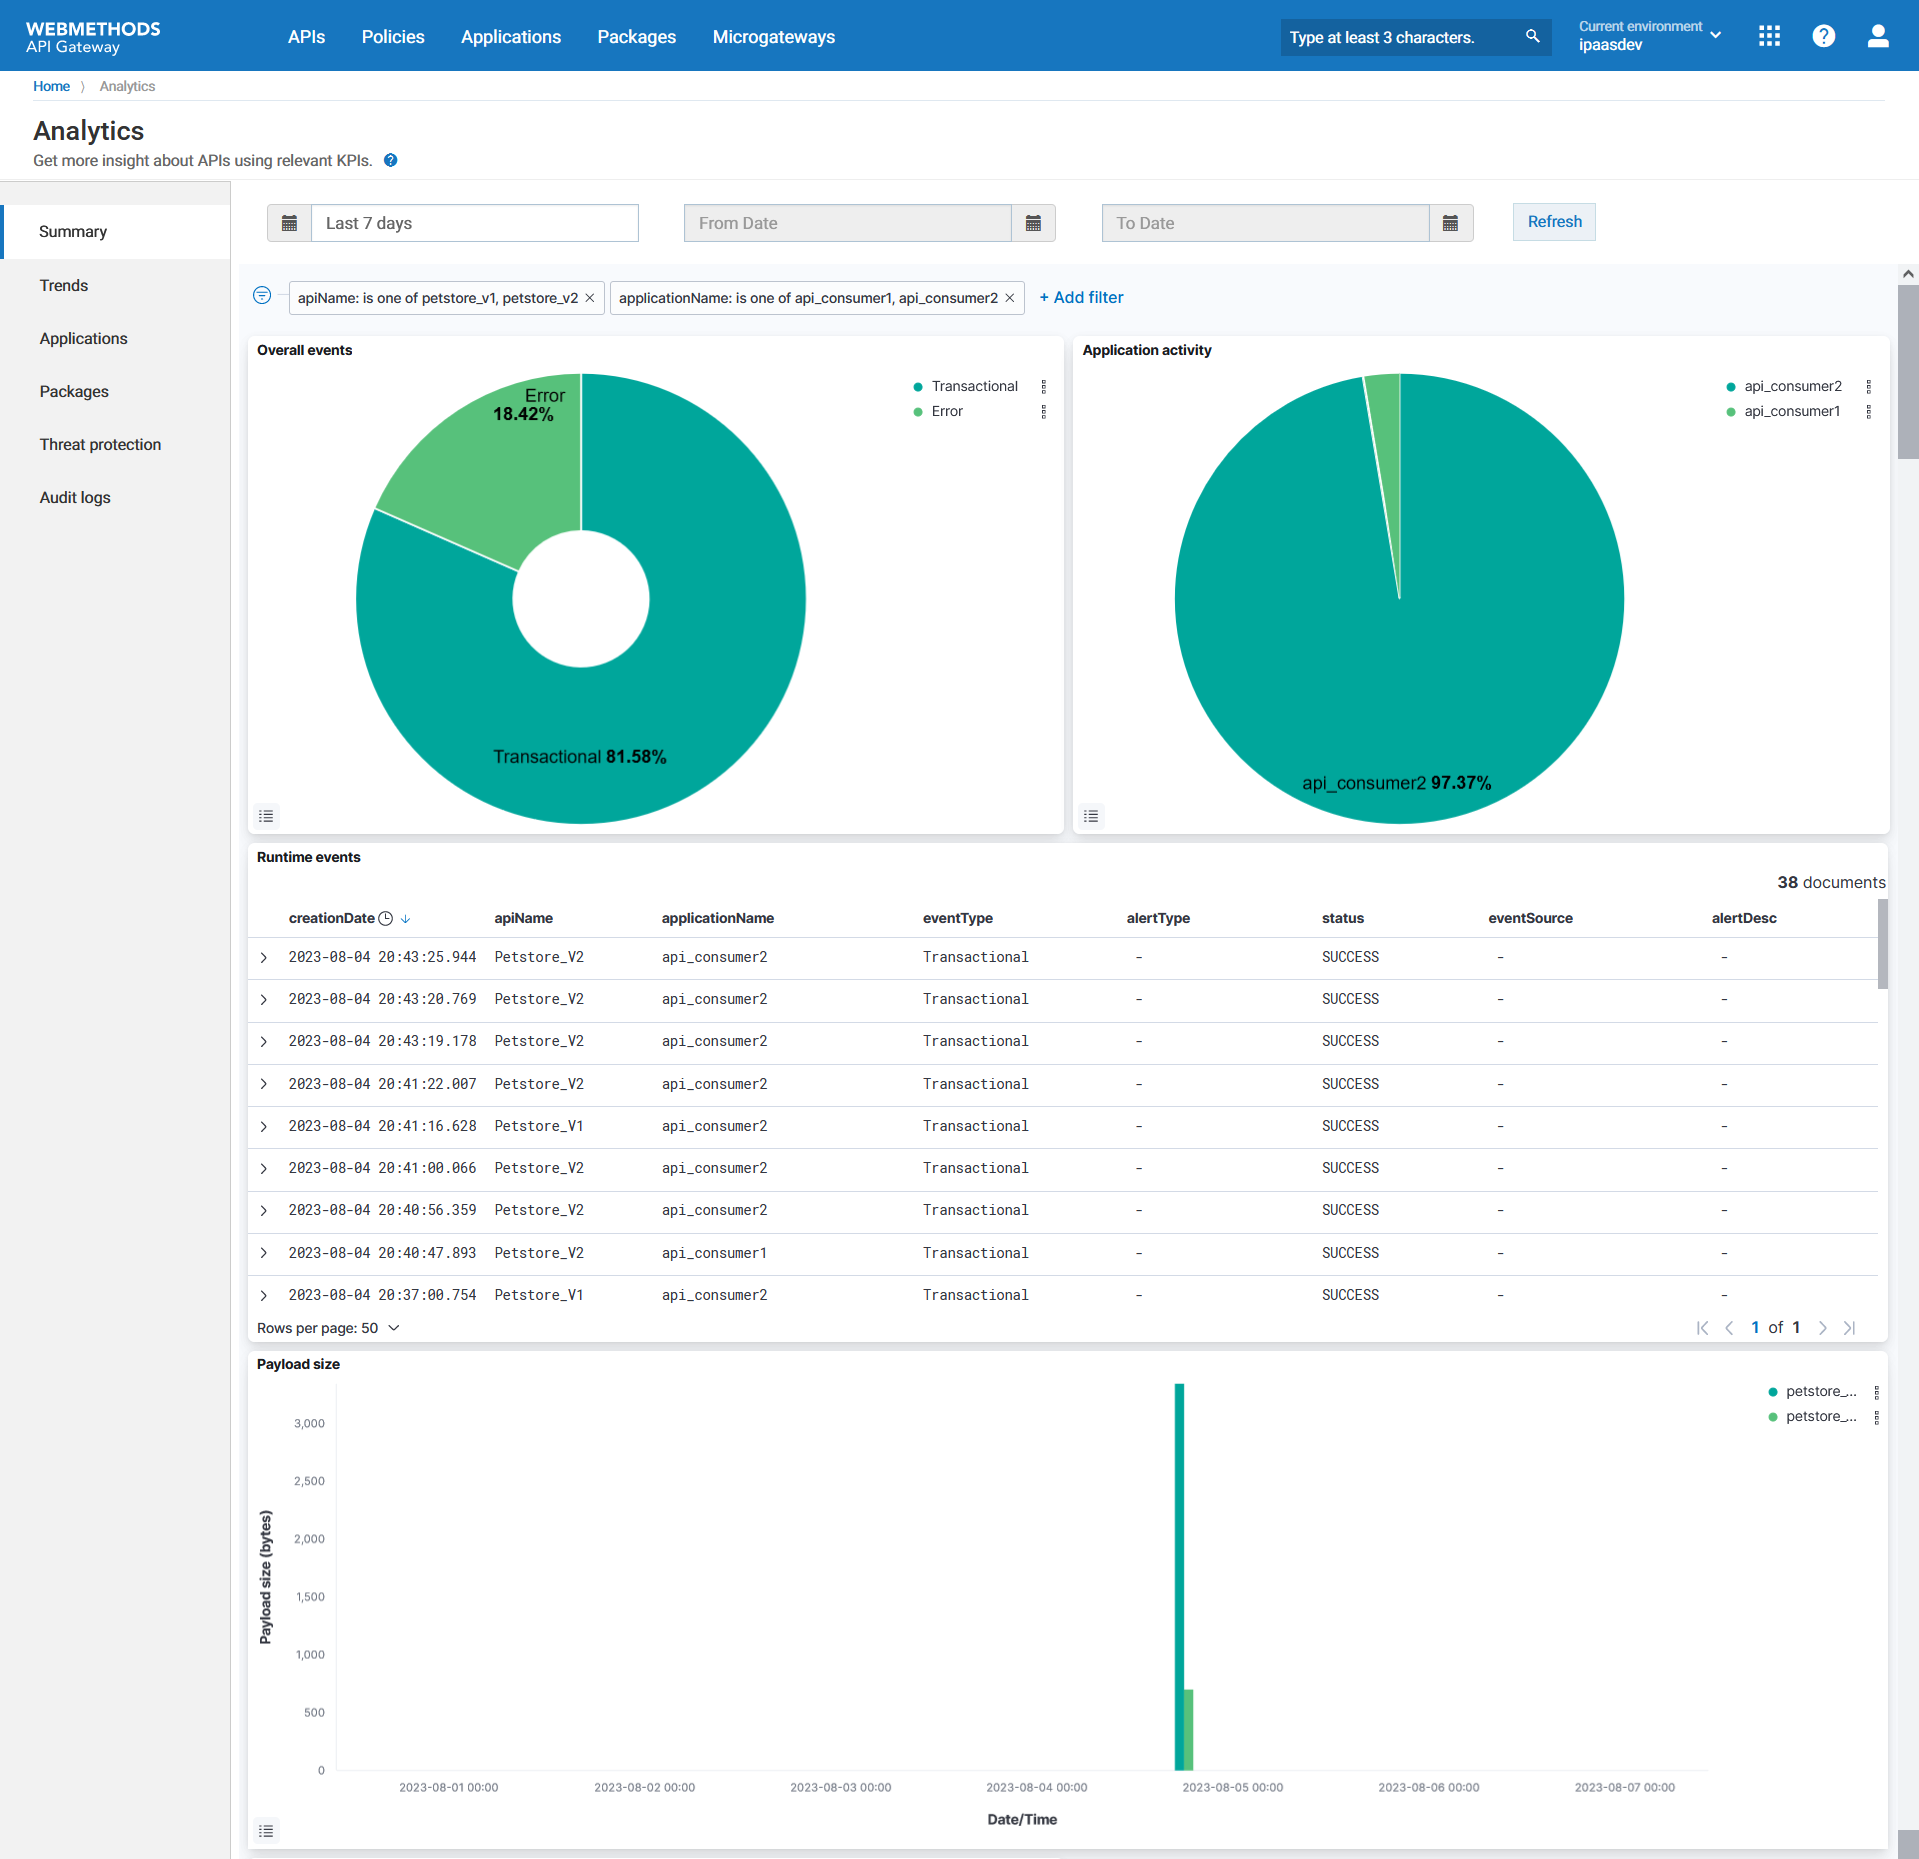
api_consumer1, api_consumer2 6. Click Save. The API Gateway-wide dashboard appears displaying the analytics pertaining to the filtered APIs and applications.
The Overall events and Application activity widgets display the graphs based on the invocations and application consumptions.