Creating custom dashboards
Pre-requisites:
You must have the API Gateway's manage custom dashboards functional privilege assigned to manage the custom dashboards in Global analytics.
The Custom dashboards has two options:
 View
View. To view custom dashboards. You can select the custom dashboard that you want to view from the drop-down list.
Build. To build custom dashboards. Here, you can create and add visualizations to build custom dashboards.
Note:
Software AG recommends that you do not modify any default visualizations. If you modify any default visualizations, an upgrade or restart of API Gateway server overwrites the modifications.
Improper visualizations or long running queries in the visualizations can impact the performance of the Elasticsearch.
You can create custom dashboards for both
API Gateway-wide analytics and API-specific analytics from the

>
Analytics page. You can create the visualizations and dashboards in the Kibana interface, and the dashboards are rendered in API Gateway user interface.

To create custom dashboards
1. Click > Analytics. 2. Click Custom dashboards > Build.
3. Build custom dashboard. For instructions, see Kibana documentation.
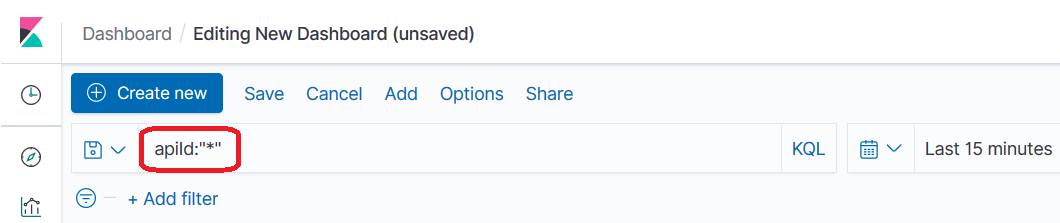
For API-specific custom dashboard, type apiId:"*" in the search box and then save the dashboard. This filter creates a custom dashboard specific to API-specific analytics.
To view the custom dashboard for API Gateway-wide analytics, click View and select the dashboard from the drop-down list.
To view the custom dashboard for API-specific analytics, click APIs > API name > Analytics. Select the custom dashboard from the drop-down list.
Note:
Permalinks and under share option are available on UI but not in operation due to vulnerability.