Filter Wiring Example for a PPM Chart App
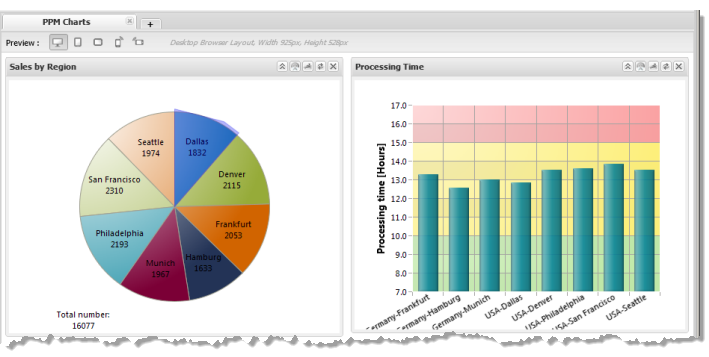
This example is a workspace using a two-column layout and the PPM Chart App in both columns pulling in two charts:
The Sales by Region chart summarizes sales across a two-level Dealer dimension with Region as the top level and City as the subordinate level. The Processing Time chart shows order processing time for the same two-level Dealer dimension. The default, unfiltered view of Processing Time shows the average time for all region/city combinations.
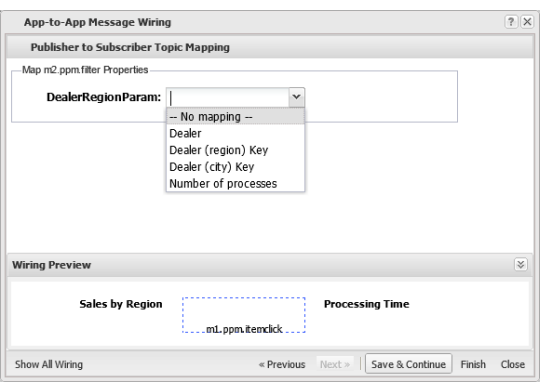
The filter is defined on Processing Time to filter the Dealer dimension with an expression to compare only the Region level:
The wiring that enables the filter interaction, uses the Filter subscription topic for Processing Time and the Item Click publish topic for Sales Region.
Mapping for the subscription topic payload, maps the Dealer (region) from the published topic to the DealerRegionParam parameter for Processing Time defined in the filter.
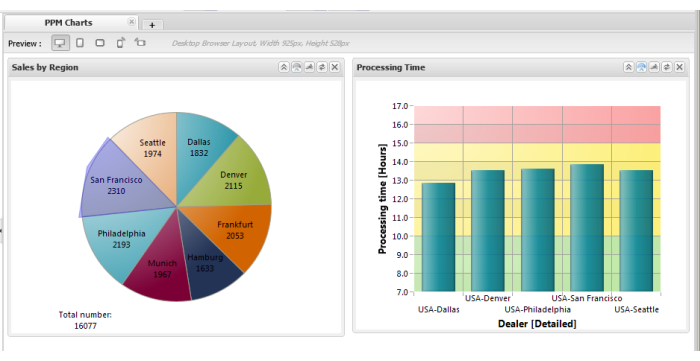
Once wiring is complete, clicking on any pie slice in Region Sales filters the data shown for Processing Time to those cities that belong to the matching region. In this example, San Francisco is selected which filters Processing Time to show the USA region: