Customize Built-In Chart Attributes
Business Analytics charts and gauges use FusionChart libraries to create the built-in charts, with the exception of real-time charts. FusionCharts libraries use a set of attributes to define the configuration options for a chart.
The Business Analytics View Wizard adds FusionChart attributes to view configuration when you create views, along with additional information used by Business Analytics. You can add these FusionChart attributes, remove these attributes or edit these attributes in view configuration information to customize the look of chart and gauge views.
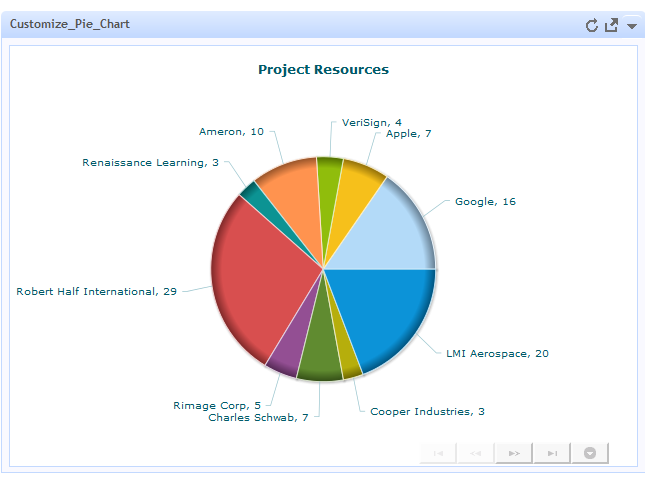
To make these attributes easy to work with, you must move this configuration from the app spec for a basic app containing this view to a separate JSON file. This topic presents an example of that process using a simple pie chart:
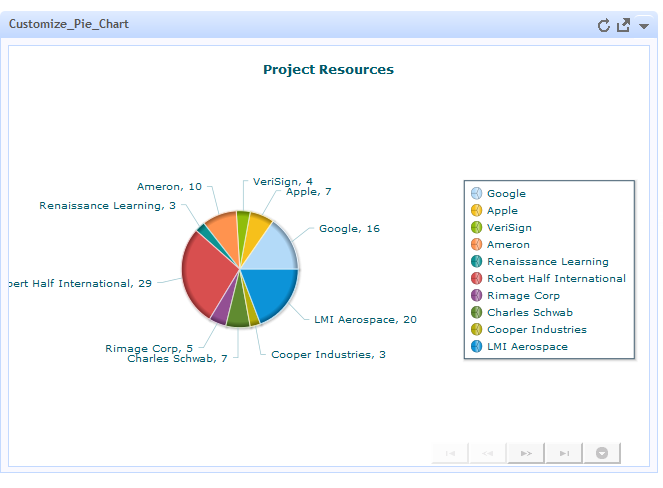
By default, the pie chart uses smart labels which are call outs (simple lines and labels). This works very well when there are quite a few pie slices, but may look very bare with fewer slices. We’re going to change this pie chart to use a legend rather than smart labels.
The Business Analytics View Wizard doesn’t allow you to configure a legend for pie charts. To use a legend in this case, you must customize the attributes that the Business Analytics View Wizard generates for the view:
2. Move the View Configuration to a JSON File. The view configuration contains the attribute settings for Fusion Charts for this view. Moving this configuration to a separate file makes it easier to edit these attributes.
Move the View Configuration to a JSON File
View configuration information is defined in a <presto-meta> element named viewconfig. The contents of this meta-data element is a JSON object, with the configuration information for one view. Because apps can have multiple views, the JSON configuration object for each view is one member of an array. This array is wrapped in a CDATA marked section to ensure that the JSON syntax does not cause parser errors for the app spec.
Disected, this would look like this:
<presto-meta name="viewconfig">
<![CDATA[
[
{...JSON config object for one view...},
{...another view config object...}
]
]]>
</presto-meta>
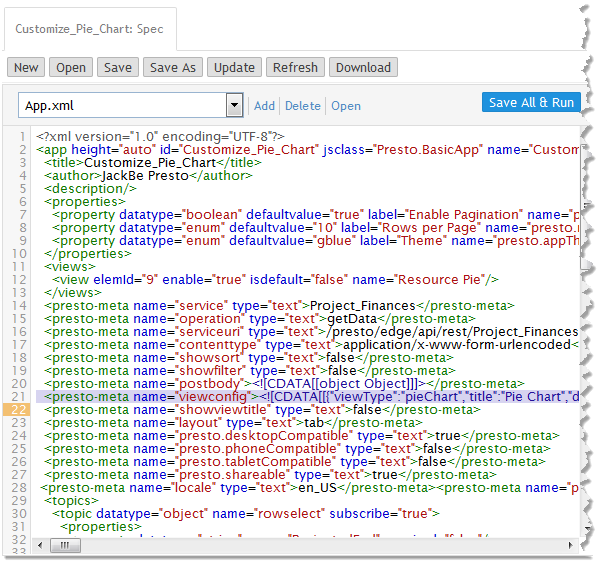
In the App Editor, you see one line for this configuration:
To move this configuration to a separate file:
1. Copy the line from the app spec with <presto-meta> for the view configuration.
2. Paste this in a blank file in a text editor of your choice.
3. Delete the <presto-meta> start and end tags.
4. Delete the start and end tags for CDATA (<![CDATA[ and ]]> being careful to retain the inner bracket symbols, [ and ], for the array with this JSON ogject.
5. Save this as a file named viewconfig.json in any folder on your computer.
Note: | This file should not be treated as a JavaScript file with .js as the file extension as this causes errors. It is also a good practice to validate this JSON using tools such as jslint. |
Once you have the JSON configuration in a file, you can add this to the basic app to make it easier to edit the chart attributes:
1. In the App Editor, click Add.
2. Click Other as the type of resource.
3. Click Browse and select the viewconfig.json file you created previously.
4. Click Add Local Resource to upload this file and add it to this basic app.
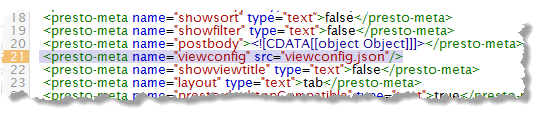
5. Edit the <presto-meta name="viewconfig"> line in the app spec to replace the in-line configuration and refer to the viewconfig.json file:
a. Delete the content of the <presto-meta> element for this line.
b. Remove the end tag and make this an empty tag, such as:
<presto-meta />
c. Add a src attribute and set the value to viewconfig.json. This line should now look like this:
6. Click Save and run to save and test these changes.
The app should display exactly as it did originally in the preview pane.
You can now begin editing viewconfig.json to tweak chart attributes as needed.
Customize the Fusion Chart Attributes
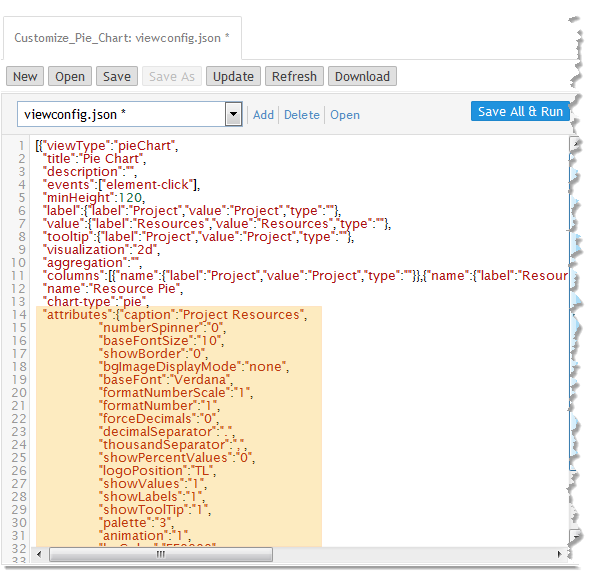
Once you are sure the viewconfig.json file is working, choose viewconfig.json from the file drop down in App Editor and break the JSON configuration up with whitespace, tabs and multiple lines to make this configuration easier to understand. The JSON for the pie chart example looks something like this:
The specific properties you see in view configuration varies depending on the type of chart and configuration options that users chose when they created the chart. The information in this JSON is used by Business Analytics and in some cases, passed directly to Fusion Chart functions.
The attributes property, in particular, is an object that contains Fusion Chart attributes that you can add to, remove or edit to take advantage of functionality not supported by the Business Analytics View Wizard. Initially, it contains both default property values and properties users chose when the view was created.
For information on Fusion Chart attributes, see documentation for:
For this example, first we add properties to display a legend. In the attributes property, add the following lines:
...
"showTooltip":"1",
"showLegend":"1",
"legendPosition":"RIGHT",
"legendMarkerCircle":"0",
"reverseLegend":"0",
"palette":"3",
...
Click Save and run and the chart should look like this:
This adds the legend but the smart lines and labels are also still there. To remove the smart lines and labels:
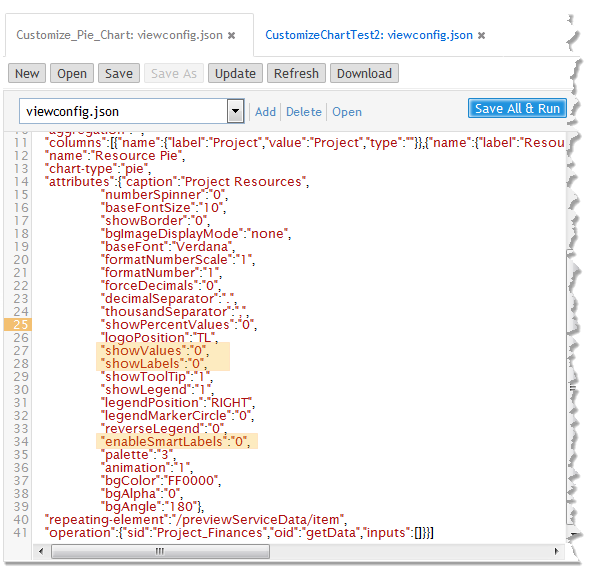
1. Add an enableSmartLabels attribute:
...
"reverseLegend":"0",
"enableSmartLabels":"0",
"palette":"3",
...
Setting this attribute to 0 turns this feature off.
2. Edit both the showLabels and the showValues attributes and set them to 0 to turn them off.
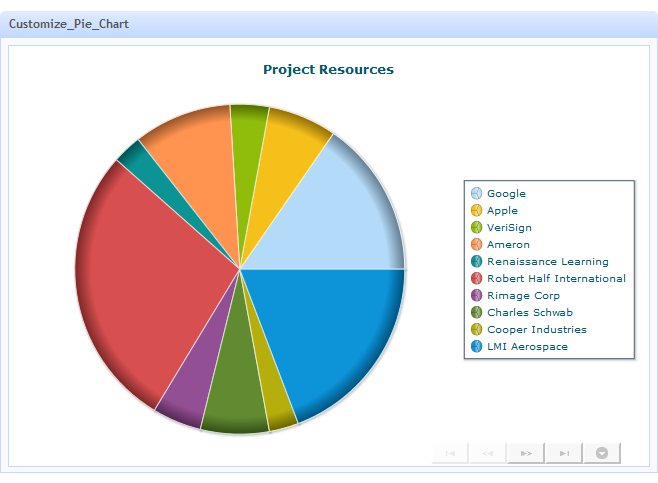
The viewconfig.json now looks like this:
Click Save and run again and the chart now has a legend with no smart lines: