Business Analytics Add-On for SharePoint Features
P4S allows users to easily combine information sources from inside and outside of SharePoint. P4S enables users to publish both mashups and apps in SharePoint as native or external lists or as Web Parts, thus enabling quick and easy creation and use of mashups and apps within SharePoint sites. The following features are supported for publishing to SharePoint:

Mashup Web Parts

App Web Parts

Inter-Web Part Communication

Snapshots of mashup results as native
SharePoint lists.

Dynamic mashups results as external
SharePoint lists.
P4S also enables easy use of SharePoint lists as mashable information sources to be used in mashups directly. These features include:

Visual mashing of
SharePoint lists or list views

Visual mashing of
SharePoint simple or advanced search results

Adding items to
SharePoint lists from
Business Analytics mashups

Easily adapting
Business Analytics mashups for integration through BCS and external
SharePoint lists
Let's have a first-hand look at some of the features of P4S and how it enhances SharePoint.
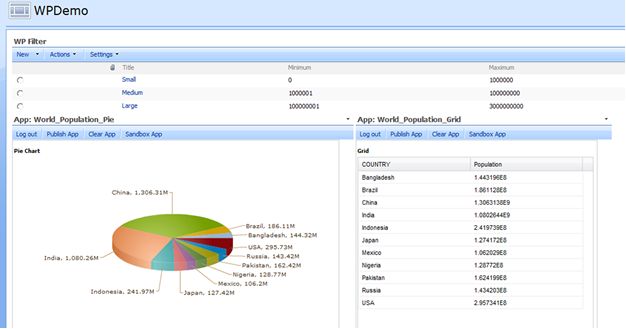
This page displays a dynamic dashboard of real-time, customizable data. The dashboard contains two apps on world population data from Business Analytics and a custom List Web Part from SharePoint.
The apps filter the countries shown based on a population range. They are connected using Inter-Web Part Communication to the custom List Web Part to allow users to easily select the range of populations they want to see.
This page was created using P4S features that are integrated into SharePoint when P4S is installed along with Business Analytics features that are enabled with the P4S add-on. Here's a brief walk-through of the steps taken to create this page:
1. It starts with creating a SharePoint list containing world population data from an Excel spreadsheet.
2. This SharePoint list is registered as a mashable with Business Analytics and used in a mashup created in Wires in the Business Analytics Hub. The mashup adds filtering to select countries within a range of population.
3. The mashup has two views defined: a pie view and a grid view of the data.These views are used to create two apps in Business Analytics Hub. The mashup and apps are all hosted in the Business Analytics Server.
4. These two apps are published to SharePoint as Web Parts in this Web Part page.
5. The third Web Part contains a SharePoint Custom List (WP Filter) which provides the values for filtering the data shown in the two apps.
6. Both apps are connected to the Custom List Web Part using Inter-Web Part Communication. As users select a population range, both apps update the data they display.
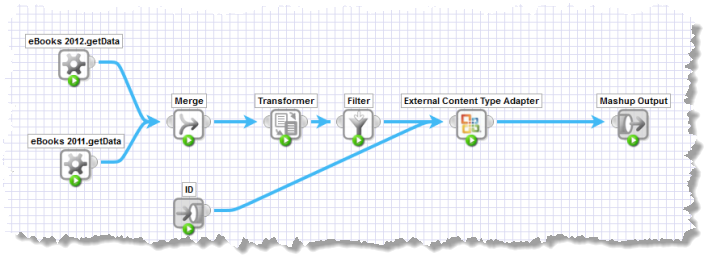
The next example shows a mashup in Business Analytics that merges and transforms information on eBooks from other mashables. The mashup uses the ECT Adapter block to adapt the mashup for use as external content in SharePoint, allowing dynamic updates to show in SharePoint.
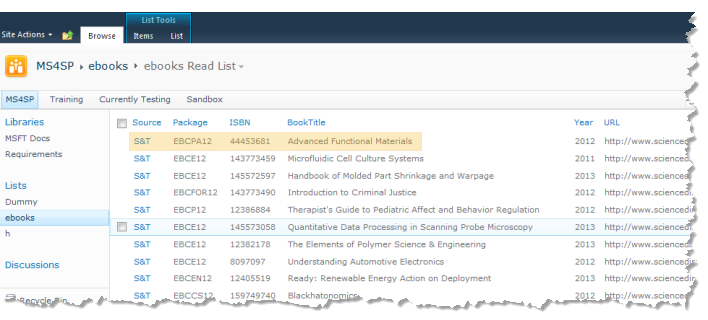
Users define an external content type in SharePoint Designer based on this mashup and then add mashup results to a SharePoint site as an external List:
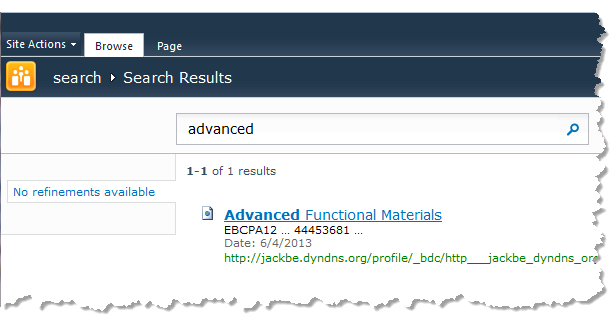
As an external List, the mashup results can now be searched or used in other SharePoint services:


