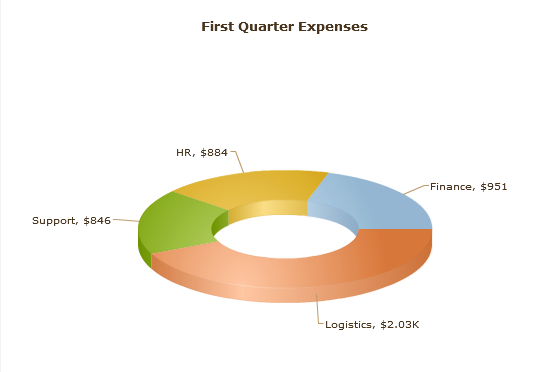
Doughnut charts, like
Pie Charts, display a single numeric data point for multiple records as percentages of a whole. The lack of a center gives a different emphasis to the data.
There are two possible relationships between a slice and the records in the data set:

