Zoom Line Chart
Zoom Line charts are s used for datasets with a large number of records to allow users to zoom in on specific areas of the chart to see details. Like line charts, zoom line charts display lines for numeric data, one for each series or column, for a set of records.
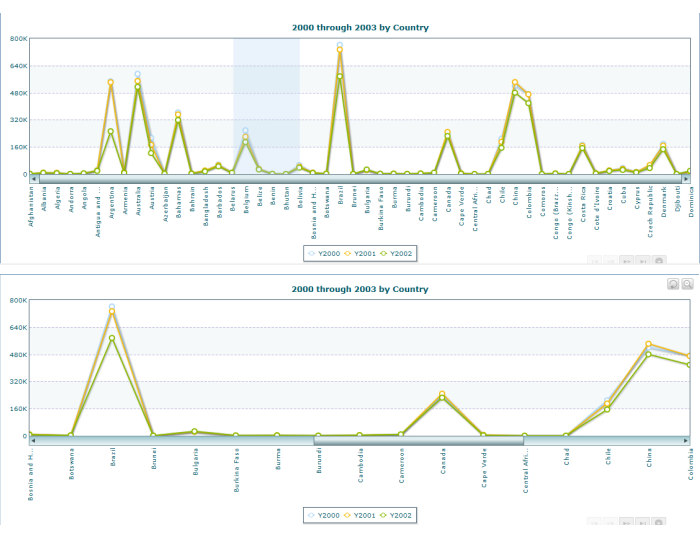
When the dataset has a large number of records, the number of records per page may need to be high which can obscure details, such as the top example shown below.
Users can simply select a portion of the X axis to zoom in and see details, as shown in the bottom example above. A small toolbar in the zoom view provides controls to return to the summary view:
Line charts are also related to
Scatter Charts and
Area Charts. For a reverse relationship between data points and records, see
Sparkline. See
Line Chart for moderate or small datasets. a