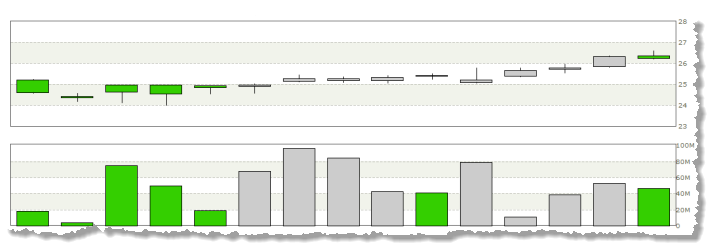
Candlestick Chart
The candelstick chart summarizes two separate pairs of numeric measures, plus an optional separate measure in an easily learned format for quick comparisons. They are most commonly used to plot stock or commodity prices, and optionally volume, along with the current trend (bear or bull) of the price.
Candlesticks combine a column overlayed with a vertical line that looks something like a candle and wick. The candle shows the start and end values (open and close) while the wick shows high and low values. Color also indicates the overall trend . It can also include a separate column chart indicating volume.