Interface Status
Universal Messaging interfaces (see
Administering TCP Interfaces, IP Multicast, and Shared Memory) enables you to connect to a realm using various protocols and ports on specific physical network interfaces on the host machine. Interfaces are also available through the Universal Messaging Administration API and can provide useful status information regarding user connections.
The Enterprise Manager provides a summary of this status information for each interface.
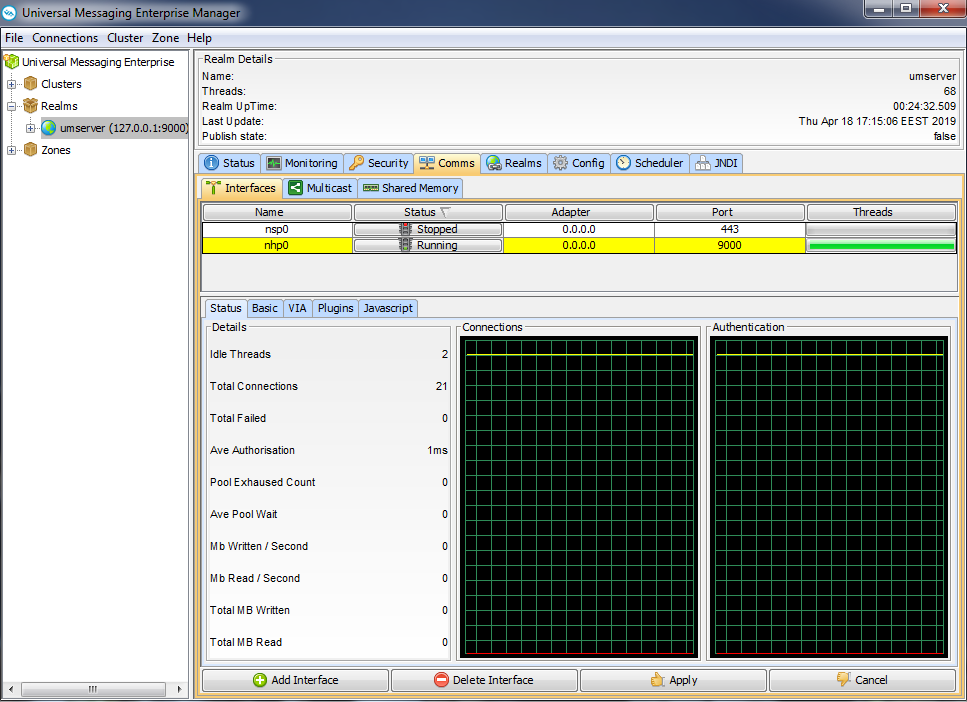
To view status information for an interface, select the Comms tab for the realm you want to view. Then click the Interfaces tab and select the interface from the list of interfaces. The following image shows the Status panel for a selected interface.
Details Panel
The interface status panel has a section that describes the details of the interface status information. The status information contains the following parameters:
 Idle Threads
- The number of idle threads, calculated as the total threads from the interface accept threads pool - the number of threads from the pool currently accepting connections. Corresponds to available threads
Total Connections - The total number of successful connections made to this interface
Total Failed - The total number of failed connection attempts made to this interface
Ave Authorisation - The average time it takes a connection to authenticate with the realm server
Pool Exhausted Count - The number of times that the interface thread pool has had no threads left to service incoming connection requests. When this count increases, you should increase the number of accept threads (see
Basic Attributes for an Interface) for the interface
Ave Pool Wait - The average time that a client connection has to wait for the accept thread pool to provide an available thread. Like the Pool Exhausted count, this is a good indicator that the number of accept threads for an interface is too low and needs to be increased
The status panel also shows two graphs that depict connection attempts (successful connections are shown in yellow, failed connection attempts are shown in red) and authentication times (average authentication times are shown in yellow, and the last authentication time is shown in red).