Charts Panel for Master Caches
Use the Charts panel as an alternative way to view some of the master cache statistics available on the Overview panel.

To view master cache information in the Charts panel
1. On the WAN tab, click Charts to display the Charts panel.
2. Select the CacheManager of the master cache you want to view.
3. Click Masters.
4. In the Cache field, select the cache you want to view.
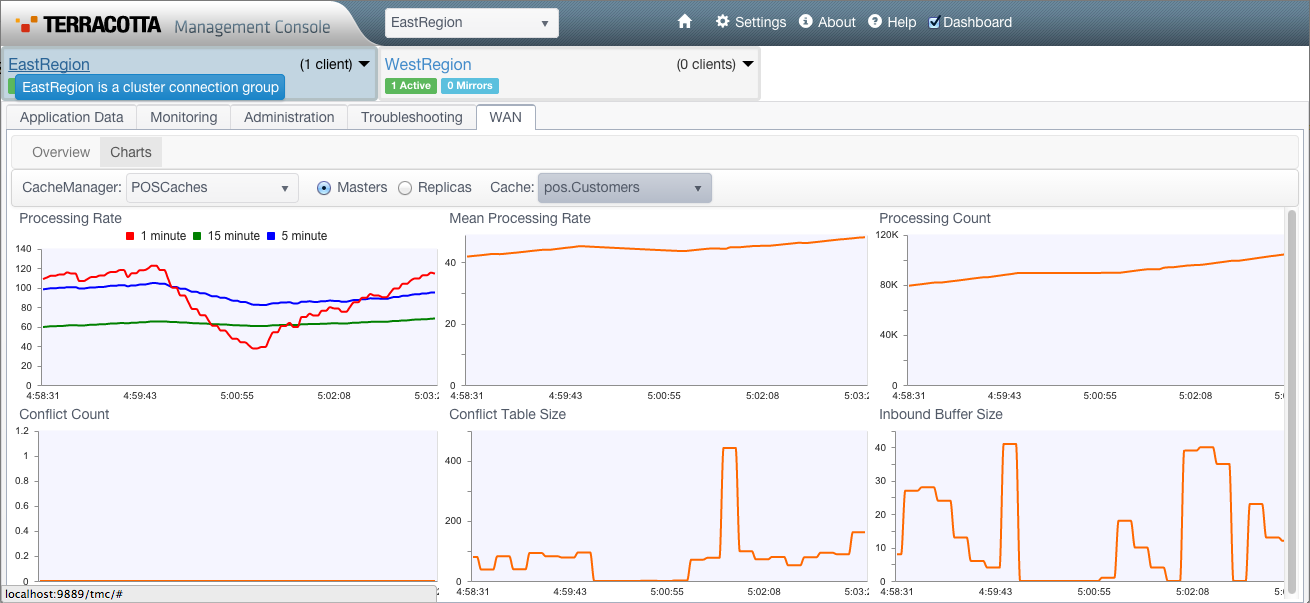
The following charts are displayed:
 Processing Rate:
 Charts the average processed transactions per second (tps) during replication. This chart plots the replication rates over one-minute, five-minute, and fifteen-minute periods. A processed transaction is one that has been recorded by the master orchestrator for immediate or eventual transmission to the replica orchestrators.
Mean Processing Rate: Charts the average processed transactions per second (tps) rate for your application's entire lifetime.
Processing Count: Charts the total number of processed transactions during your application's entire lifetime.
Conflict Count: Charts the number of conflicts that were resolved during replication.
Conflict Table Size:: Charts the number of element modification entries (puts/updates/deletes) that are currently outstanding. These entries may or may not have had a conflict; it simply means that they have not yet been replicated to all the replicas in the WAN. This number could be higher than
Conflict Count.
Inbound Buffer Size: Charts the size of the cluster listener buffer.