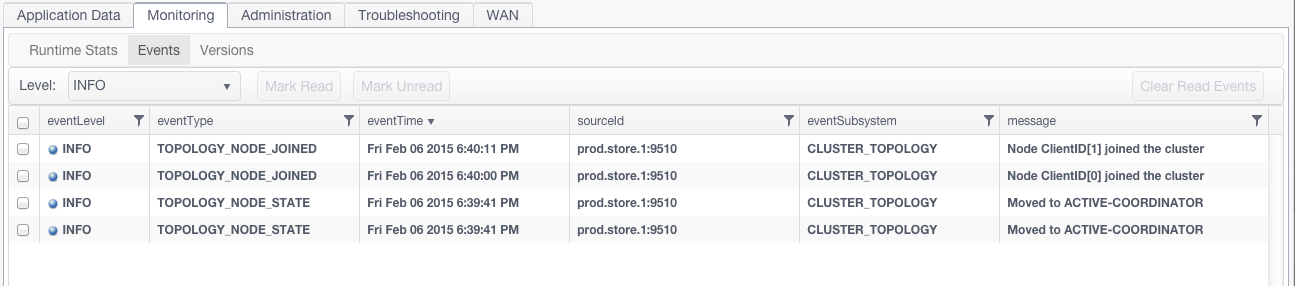
Events
The Events panel displays cluster events received by the Terracotta server array. You can use this panel to quickly view these events in one location in an easy-to-read format, without having to search the Terracotta logs.
The number of unread events is shown in a badge on each clustered connection's mini dashboard. The badge color indicates the severity of unread events: red for warnings and above, or gray if all unread events are of lower severity.
From Monitoring > Events, the Level dropdown list allows you to select DEBUG, INFO, WARN, ERROR, or CRITICAL. Events will display that are equal to or higher than the level you select. For example:

If you select INFO, only DEBUG events are filtered out.
If you select WARN, you will see events at the WARN, ERROR, and CRITICAL levels.
Click any column head to order the list. Use the buttons to mark events as read or unread, and to clear read events.
For more information about event types, see "Monitoring Cluster Events" in the BigMemory Max Administrator Guide.
Note:
In respect of considerations concerning EU General Data Protection Regulation (GDPR), be aware that in cases of incorrect login procedure or other error scenarios, LDAP username and IP address may be logged in the tmc-security log file. Amongst other events, such data may be collected for reasons of configuring messages based on such logs. LOG4J offers possibilities for log-purging and log-retention, which may offer useful strategies to avoid unwanted loss or exposure of sensitive data possibly conflicting with regulations.