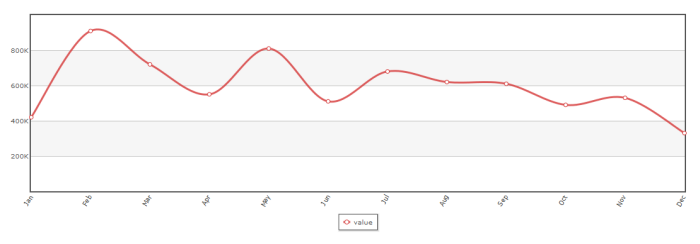
Spline Line Chart
Spline charts display one or more numeric dimensions for a set of records as curved lines that illustrate the trend or change between data points. This is similar to line charts, but the fitted curves are more appropriate for continuous data.

