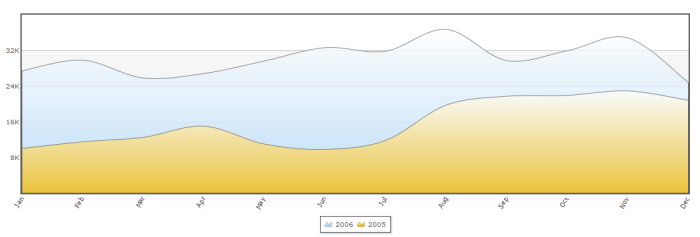
Spline Area Chart
Spline Area charts display one or more numeric dimensions for a set of records as curved lines with the area underneath each curve filled with color. This is similar to area charts, but the fitted curves are more appropriate for continuous data.

