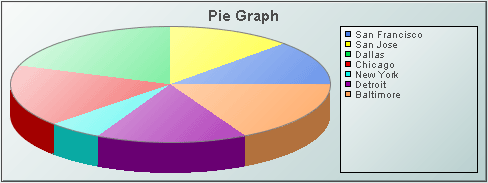
Pie graph
Pie graphs visualize one or more numerical columns from tabular data. A typical attachment has either one row and multiple numeric columns, or multiple rows with one numeric column and one non-numeric column (whose values are used as graph labels that uniquely identify each row).
A pie graph can visualize data in either of two ways:

Column series: The first numeric column of the visualized data is used to populate the wedges in the pie. Each wedge corresponds to a row and displays that row's relative value.

Row series: The first row of the visualized data is used to populate the wedges in the pie. Each wedge corresponds to a numerical column and displays that column's relative value.
Use the
valueTable property to attach data to a pie graph. Use the
rowSeriesFlag property to specify row series or column series visualization.
When a pie graph is selected in the Builder canvas, the Object Class Name that appears at the top of the Object Properties pane is obj_pie.
The Object Properties panel organizes pie graph properties into the groups below.
